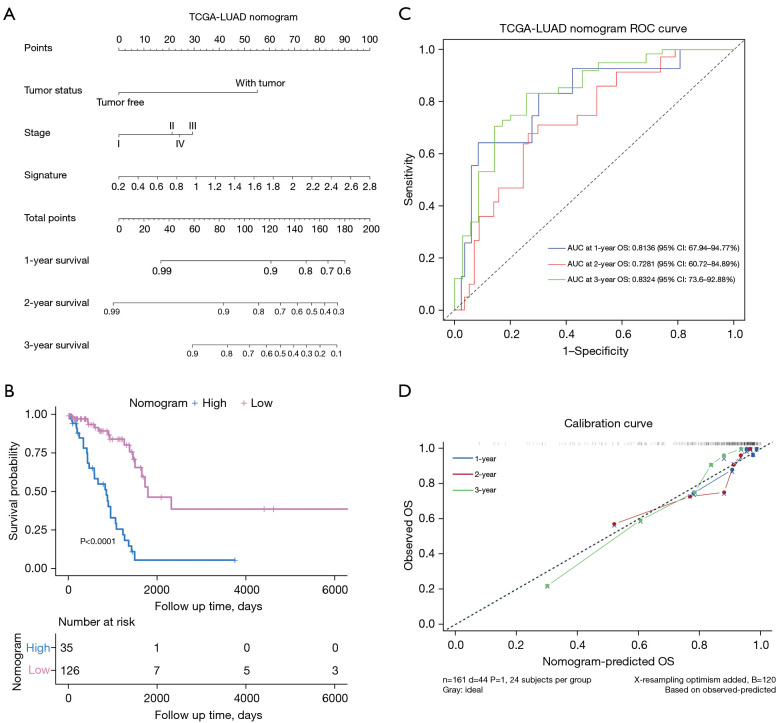
Figure 6.
The performance of the nomogram in predicting the prognosis in TCGA-LUAD dataset. (A) A prognostic nomogram predicting the 1-, 2-, and 3-year OS of LUAD patients. (B) The nomogram’s KM survival curves. Patients from TCGA-LUAD dataset were stratified into two risk groups according to optimal cutoff values of the nomogram (calculated by X-tile software). (C) ROC curves of the 1-, 2-, and 3-year OS predictions of the nomogram. (D) Calibration plot of the 1-, 2-, and 3-year OS of the nomogram. TCGA, The Cancer Genome Atlas; LUAD, lung adenocarcinoma; ROC, receiver operating characteristic; AUC, area under the ROC curve; OS, overall survival; CI, confidence interval; KM, Kaplan-Meier.

