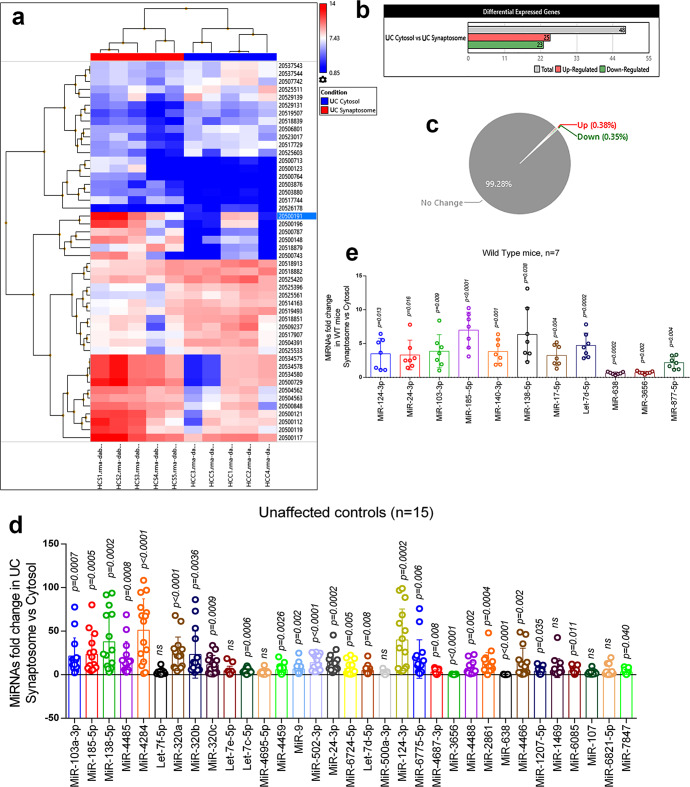
Fig. 2. MiRNAs expression in synaptosome and cytosol in a healthy state.
a Hierarchical clustering and heatmap of significantly deregulated miRNAs in the synaptosome and cytosol of unaffected controls. (red color intensity showed the miRNAs upregulation and blue color intensity showed the miRNAs downregulation). b Total number of miRNAs deregulated in cytosol vs synaptosome in unaffected controls. (grayscale bar—total number of miRNAs; red scale bar—upregulated miRNAs; green scale bar—downregulated miRNAs). c Pi diagram showed the total miRNAs pool distribution and percentage of miRNAs population changed in cytosol and synaptosome in unaffected controls. d qRT-PCR-based validation analysis of significantly deregulated miRNAs in unaffected controls (n = 15). MiRNAs expression was quantified in terms of fold changes in unaffected controls synaptosomes compared to the cytosol. Each circle dot represents one sample. e Validation analysis of significantly deregulated mmu-miRNAs in WT mice (n = 7). MiRNAs expression was quantified in synaptosome relative to the cytosol. Each circle dot represents one animal. Values in the bar diagrams are mean ± SEM and error bars are equivalent throughout the figure (e, d).

