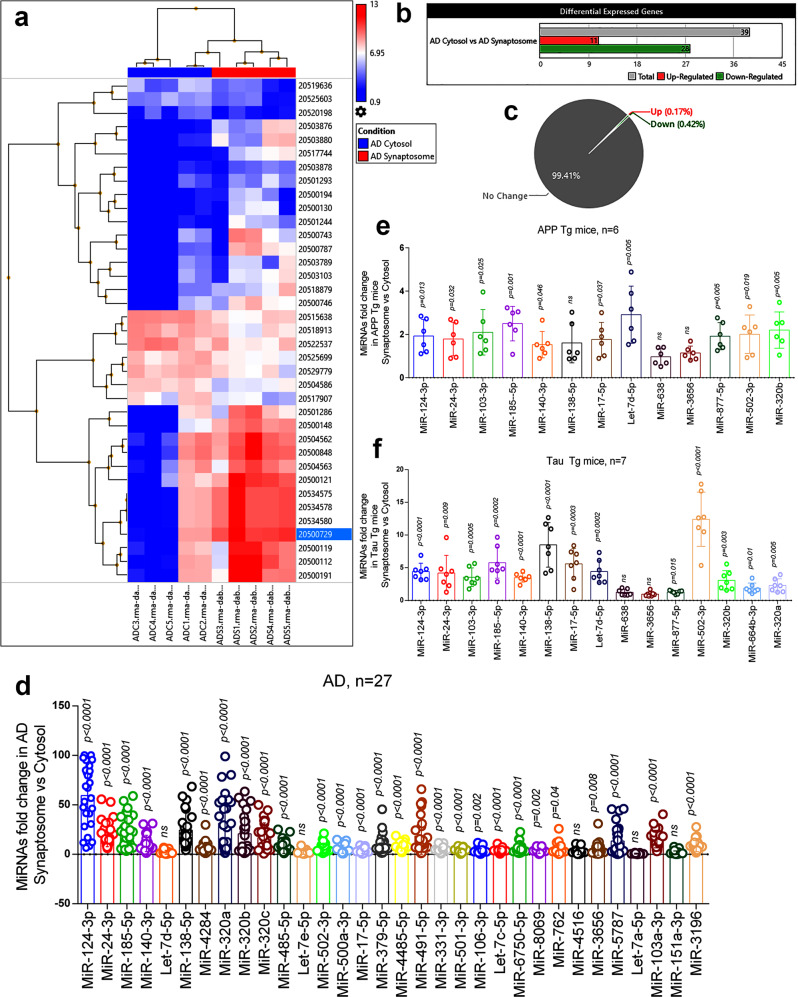
Fig. 3. MiRNAs expression in synaptosome and cytosol in AD.
a Hierarchical clustering and heatmap of significantly deregulated miRNAs in cytosol and synaptosome in AD samples. (red color intensity showed the miRNAs upregulation and blue color intensity showed the miRNAs downregulation) b Total numbers of miRNAs deregulated in cytosol and synaptosome in AD. (grayscale bar—total number of miRNAs; red scale bar—upregulated miRNAs; green scale bar—downregulated miRNAs). c Pi diagram showed the total miRNAs pool distribution and percentage of miRNA populations changed in cytosol and synaptosome. d qRT-PCR-based validation analysis of significantly deregulated miRNAs in AD samples (n = 27). MiRNAs expression was quantified in terms of fold changes in AD synaptosome compared to AD cytosol. Each circle dot represents one sample. e Validation analysis of significantly deregulated mmu-miRNAs in APP-Tg (n = 6) mice. MiRNAs expression was quantified in synaptosome relative to the cytosol. Each circle dot represents one animal. f Validation analysis of significantly deregulated mmu-miRNAs in Tau-Tg (n = 7) mice. MiRNAs expression was quantified in synaptosome relative to the cytosol. Values in the bar diagrams are mean ± SEM and error bars are equivalent throughout the figure (d–f).

