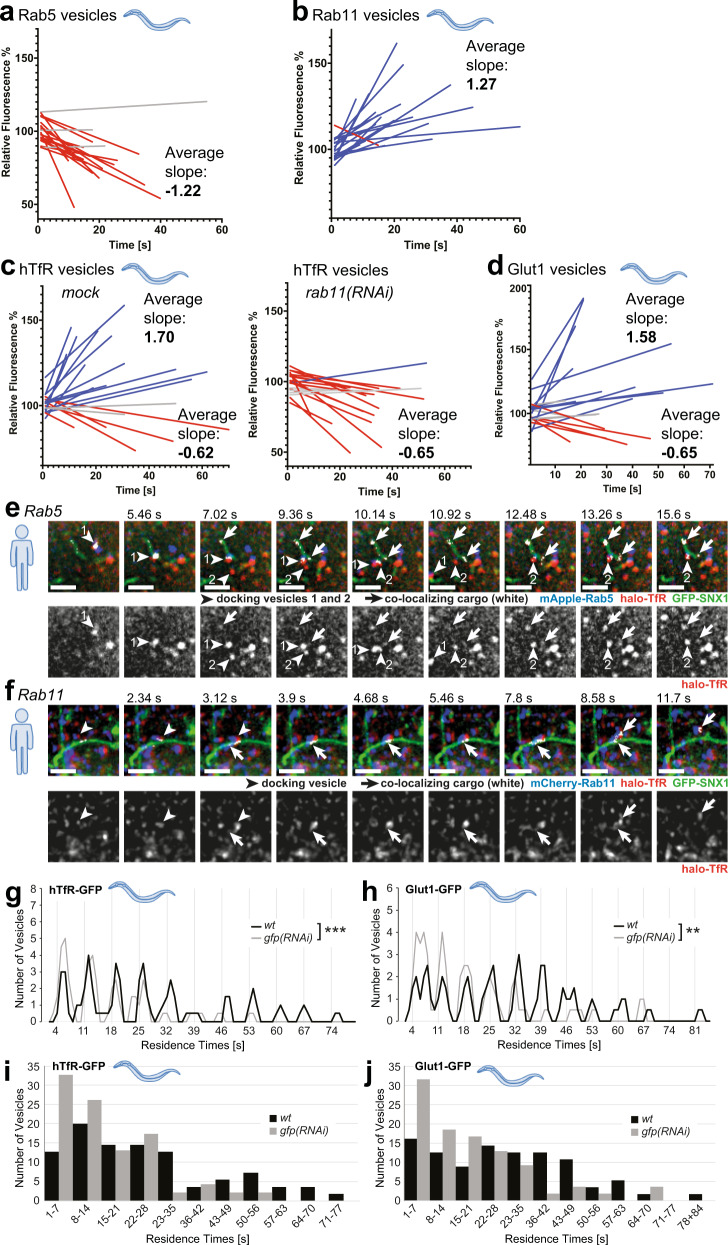
Fig. 5. Cargo transfer during kiss-and-run events in worms and HeLa cells.
a Fluorescence intensities of single vesicles were measured during the docking phase of kiss-and-run events. Linear regressions were calculated for Rab5 vesicles (n = 20), normalized and plotted together (single-vesicle graphs are shown in Supplementary Fig. 6c). b Rab11 vesicles were analyzed as described in a. c Cargo containing vesicles (hTfR-GFP) displayed either increasing or decreasing fluorescence intensities (see also Supplementary Fig. 6d for single-vesicle plots). d Analysis of Glut1-GFP-positive vesicles showed a similar result as for hTfR-GFP in c. e Cargo transfer from Rab5 vesicles into SNX1 compartments. Movie stills (from Supplementary Movie 15) showing halo-TfR (red) in docking Rab5 vesicles (blue) that is moving into a SNX1 tubule (green). Co-localizing pixels (shown in white and with arrows) were determined with the “co-localization finder” plugin in ImageJ. The halo-TfR channel is also shown for comparison. Two vesicles serially dock at the same site on the SNX1 tubule (shown by arrowheads 1 and 2). (n = 3 experiments with n = 20 cells each). Scale bar: 2 µm. f Rab11 vesicles can take up halo-TfR cargo from SNX1 tubules. Rab11 vesicle (blue, arrowhead) docking on to a SNX1 tubule (green) taking up TfR (red). Co-localizing pixels (arrows pointing at white pixels) were determined by the “co-localization finder” plugin of ImageJ. Single-channel images for halo-Tfr are also shown for comparison. Stills are from Supplementary Movie 15. (n = 3 experiments with n = 20 cells each). Scale bar: 2 µm. g Residence times for hTfR-GFP vesicles decrease when cargo amount is reduced. Moving average for residence times is shown for wild-type (no knock-down, n = 55) and gfp(RNAi) (n = 46) (see Supplementary Fig. 7f, g for alternative graphs). Graphs with individual vesicle data are shown in Supplementary Fig. 7e. Unpaired two-tailed t-test: P = 0.000655. h Residence times for Glut1-GFP vesicles decrease when cargo amount is reduced. Residence times are plotted as in a for wild-type (no RNAi, n = 56) and gfp(RNAi) (n = 54). (see Supplementary Fig. 7h, i for alternative graphs). Unpaired two-tailed t-test: P = 0.00268. i, j Bar graphs with binning for each peak in g and h, showing the number of vesicles in each peak.

