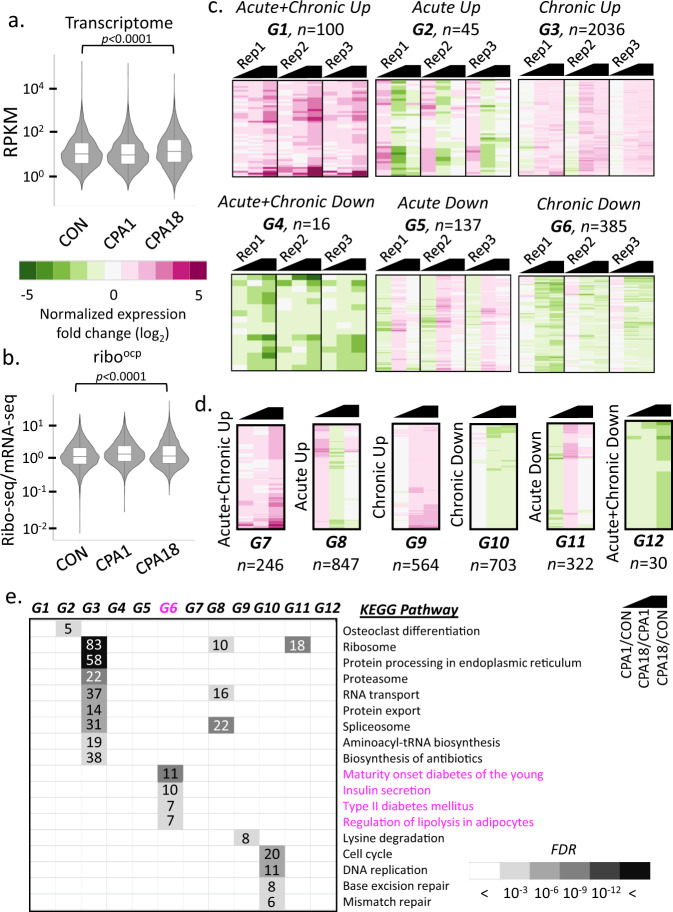
Fig. 3. Analysis of transcriptomes and translatomes during progression from acute to chronic phase of ER stress in MIN6 cells.
Violin plots representing transcriptomes (a) and translatomes (b), of untreated (CON), 1 h CPA treated (CPA1) and 18 h CPA treated (CPA18) cells. The boxes indicate the 25–75th percentiles, the midline indicates the median, whiskers show the maximum/minimum. p-value represents the statistical test by two-sided Wilcoxon signed-rank test. Heatmaps and the classifications of changes in the expression of transcriptomes (c) and translatomes (d) between CON and CPA1 (CPA1/CON), CPA18 and CPA1 (CPA18/CPA1) and CPA18 and CON (CPA18/CON) datasets. Black symbol indicates the compared datasets. Three independent experiments were used with significance of gene expression. Letter code G1-G12 indicates the gene sets of assigned common regulation and n, indicates the number of genes per group. e KEGG pathway analysis of the classified groups of transcriptomes and translatomes. Boxed numbers indicate the number of genes identified in the individual pathways. FDR, False Discovery Rate.

