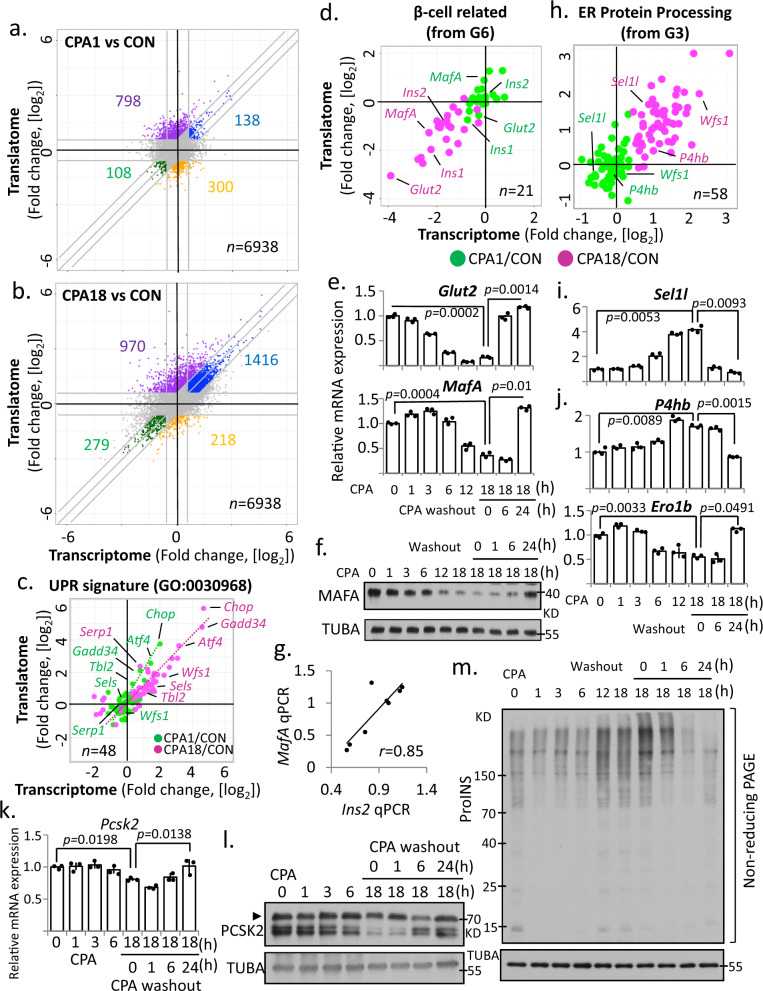
Fig. 4. Transcriptional and translational reprogramming in MIN6 cells in response to CPA induced ER stress.
Scatterplots of fold changes in CPA1 vs CON (a) and CPA18 vs CON (b). c, h Scatterplot of fold changes of the UPR signature (GO:0030968) gene expression between acute (CPA1/CON) and chronic (CPA18/CON) ER stress. d Scatterplot of fold changes of genes in groups identified in Fig. 3E (G6 and G3) in acute (CPA1/CON) and chronic (CPA18/CON) ER stress. e, i, j qRT-PCR analysis for the indicated mRNAs normalized to GAPDH mRNA levels, in MIN6 cells treated with CPA for the indicated times, n = 3. f, l Western blot analysis for the indicated proteins in MIN6 cells. g Scatterplot representing an association between Ins2 and MafA mRNA levels measured by qRT-PCR. k qRT-PCR analysis of Pcsk2 mRNA levels normalized to GAPDH mRNA levels, in MIN6 cells under the indicated treatments, n = 3. m Western blot analysis of proinsulin in non-reducing SDS-PAGE electrophoresis. Error bars represent S.E.M. p-value represents the statistical test by two-tailed paired Student’s t-test. Representative western blotting images were shown. Dots in all plots represent independent experiments. Source data are provided as a Source Data file.

