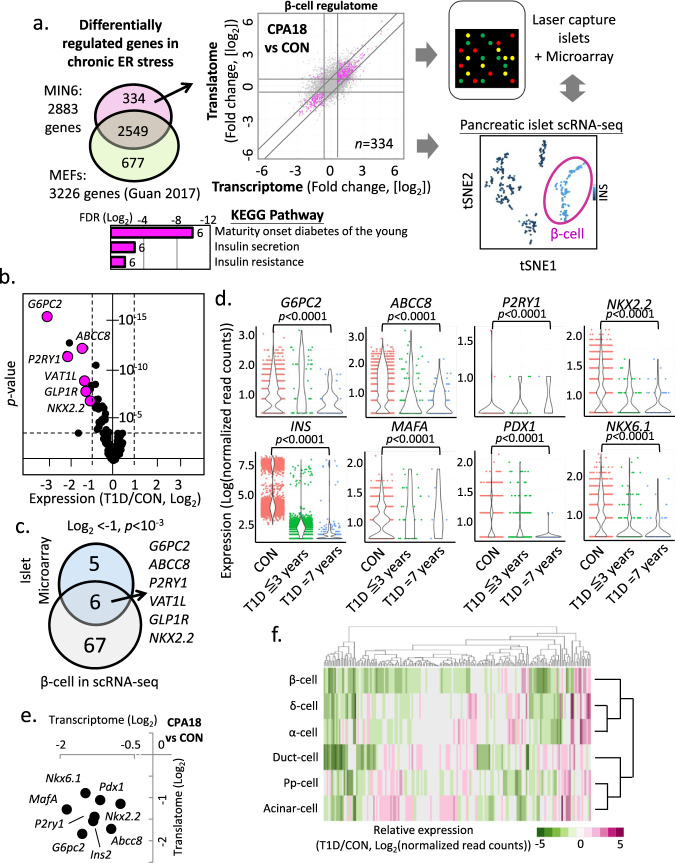
Fig. 6. Altered expression of the β-cell ER stress-induced gene set (regulome) in T1D islets reveals biomarkers of T1D progression.
a Schematic representation of the β-cell ER stress gene set (334 genes) in MIN6 cells and determination of its expression in T1D islets or scRNA-seq datasets. Scatterplot indicates in color the expression patterns of the 334 gene set during chronic ER stress in MIN6 cells. The KEEG pathway of the 334 gene set is shown below a. b The 334 gene set expression profile in T1D islet microarray datasets, shown by a volcano plot. p-value represents the statistical test between CON and T1D by two-sided Wilcoxon–Mann–Whitney test. c Venn-diagram showing the common repressed genes of the 334 gene set in T1D, between islet microarray and β-cells scRNA-seq datasets. p-value represents the statistical test between CON and T1D by two-sided Wilcoxon–Mann–Whitney test. d Expression of genes in β-cells scRNA-seq datasets of healthy donors (CON), early T1D (T1D ≦3 years) and prolonged T1D (T1D = 7 years) patients. p-value represents the statistical test by two-sided Wilcoxon–Mann–Whitney test. e Scatterplot of fold change in MIN6 cells during chronic ER stress (CPA18 vs CON). f Heatmap of gene expression profiles of the 334 gene set in different cell types of T1D scRNA-seq datasets, compared to healthy donors.

