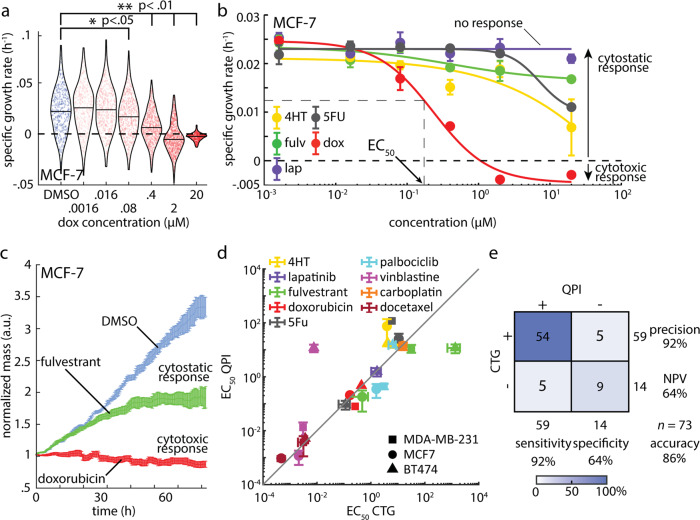
Fig. 2. Dose response measurement with QPI is concordant to CTG and also characterizes mechanism-dependent depth of response.
a QPI measurements of the specific growth rate distributions for MCF-7 cells at increasing concentrations of doxorubicin. Individual specific growth rate measurements are indicated by points in the distribution. Blue: DMSO control, red: doxorubicin. Black outline is a kernel density function fit to the distribution of specific growth rates for each condition. *p < 0.05, **p < 0.01. b Each point on the dose response curve represents the specific growth rate of 450–700 MCF-7 cell clusters averaged over 27 individual imaging locations used to fit a 4-point Hill equation to dose response data for measurement of EC50 and depth of response. Color indicates drug. Cytostatic response is noted as a moderate decrease in SGR, while cytostatic responses are indicated by a minimum asymptote of the hill curve at or below zero. c Average mass normalized by the initial mass of each cluster versus time for 486 clusters in response to 20 μM doxorubicin treatment, 615 clusters in response to 20 μM fulvestrant, and 476 clusters treated with DMSO control. Cytostatic response can be observed as the population slows mass accumulation (fulvestrant) while a cytotoxic response results in a gradual loss of mass due to cell death (doxorubicin). d Comparison of EC50 from Hill equation fitting to CTG and QPI data. Gray line shows the expected relationship (EC50,CTG = EC50,QPI). Color indicates drug, symbol indicates cell line. Correlation coefficient, R = 0.83, p = 7.5 × 10⁻⁷, Concordance coefficient = 0.84. e Confusion matrix showing the precision and accuracy of QPI relative to CTG by comparing the frequency QPI predicts the same outcome as CTG. Error bars show standard error of the mean (SEM).

