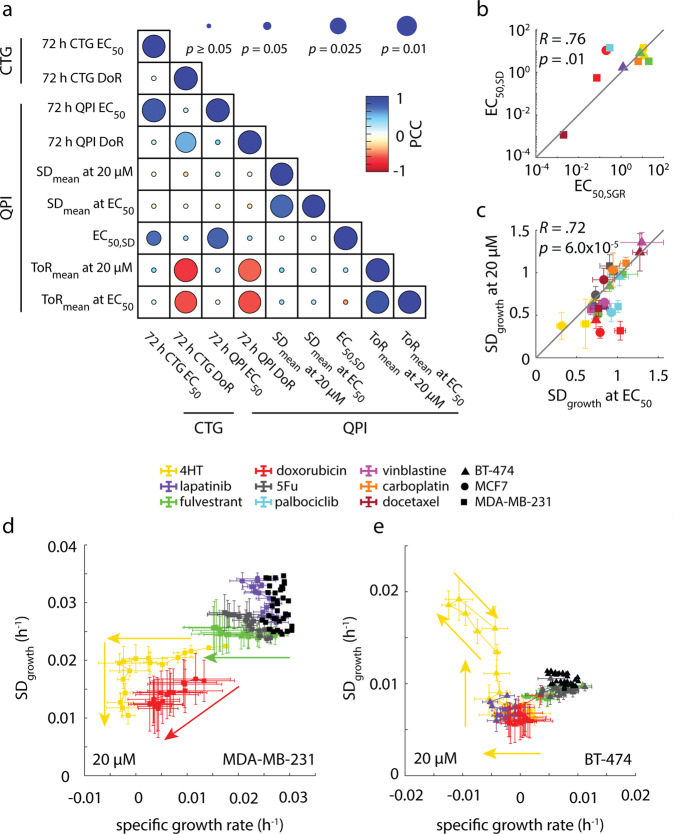
Fig. 5. QPI functionally classifies drugs based on how they affect cell behavior.
a Correlation matrix showing how functional measurements are related and predictive of how cancer therapies affect heterogeneity. b EC50,SD is strongly correlated with EC50,SGR (R = 0.76, p = 0.01) c Standard deviation in growth at 20 µM concentration is strongly correlated with standard deviation of growth at EC50. d Plot of mean specific growth rate plotted against standard deviation in growth parameterized by time for MDA-MB-231 cells treated with maximal concentration of drug panel A. e Plot of mean specific growth rate plotted against standard deviation in growth parameterized by time for BT-474 cells treated with maximal concentration of drug panel A. Control cells for d and e are shown as a cluster of black dots. Arrows in d and e show forward direction in time. Error bars show SEM.

