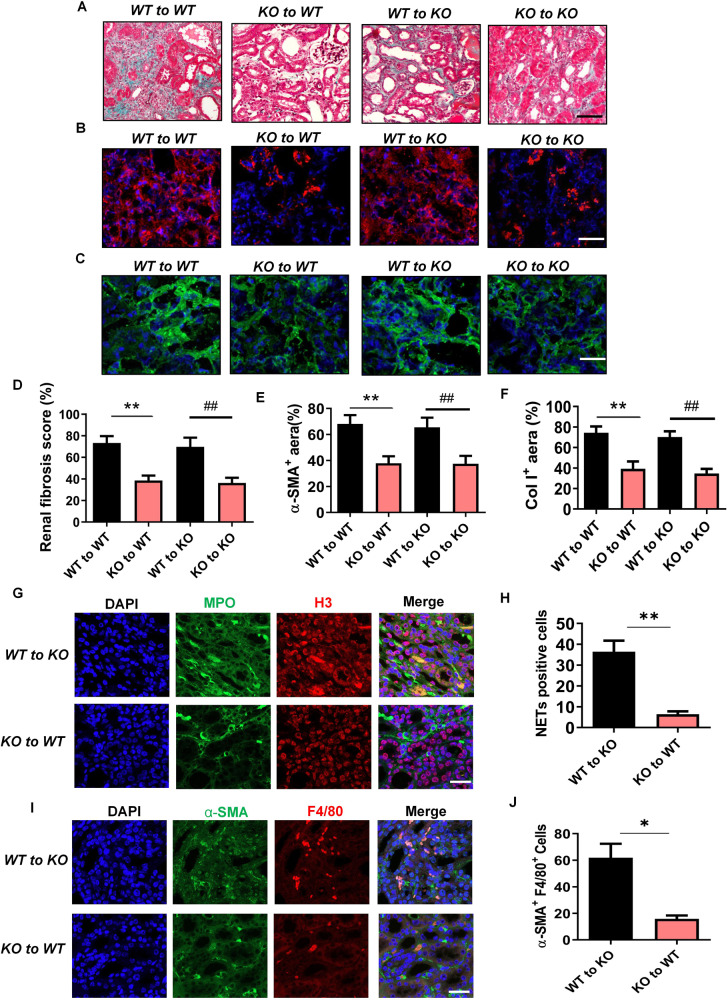
Fig. 5. Gsdmd deficiency in bone marrow-derived cells instead of renal parenchymal cells reduced renal fibrosis progression after UUO.
A Representative images of Masson trichrome staining of kidney sections. Kidneys were isolated from bone marrow chimeric mice (Gsdmd+/+ to Gsdmd+/+, Gsdmd+/+ to Gsdmd−/−, Gsdmd−/− to Gsdmd+/+ and Gsdmd−/− to Gsdmd−/−) on day 13 after UUO. Scale bar: 100 μm. B, C Representative images of immunofluorescence staining of kidney sections from bone marrow chimeric mice, showing the expression of α-SMA B and Col I C. DAPI (blue) was used for nuclear staining. Scale bar: 100 μm. D–F Quantification of renal fibrosis scores evaluated by Masson trichrome staining D, α-SMA E and Col I F expression by immunofluorescence. n = 6. G, H Representative images of immunofluorescence staining of kidney sections from Gsdmd+/+ to Gsdmd-/-, Gsdmd-/- to Gsdmd+/+ mice on day 7 after UUO, showing the expression of Histone-H3 and MPO and quantification of cells undergoing NETs formation characterized by H3 and MPO double positive. n = 6. Scale bar: 100 μm. I, J Representative images of immunofluorescence staining of kidney sections from Gsdmd+/+ to Gsdmd−/−, Gsdmd−/− to Gsdmd+/+ mice, showing the coexpression of α-SMA and F4/80 in macrophage-to-myofibroblast trasition cells on day 7 after UUO and quantification of cells coexpressing α-SMA and F4/80 by immunofluorescence. n = 6. Scale bar: 100 μm. *P < 0.05; **P < 0.01; ##P < 0.01.

