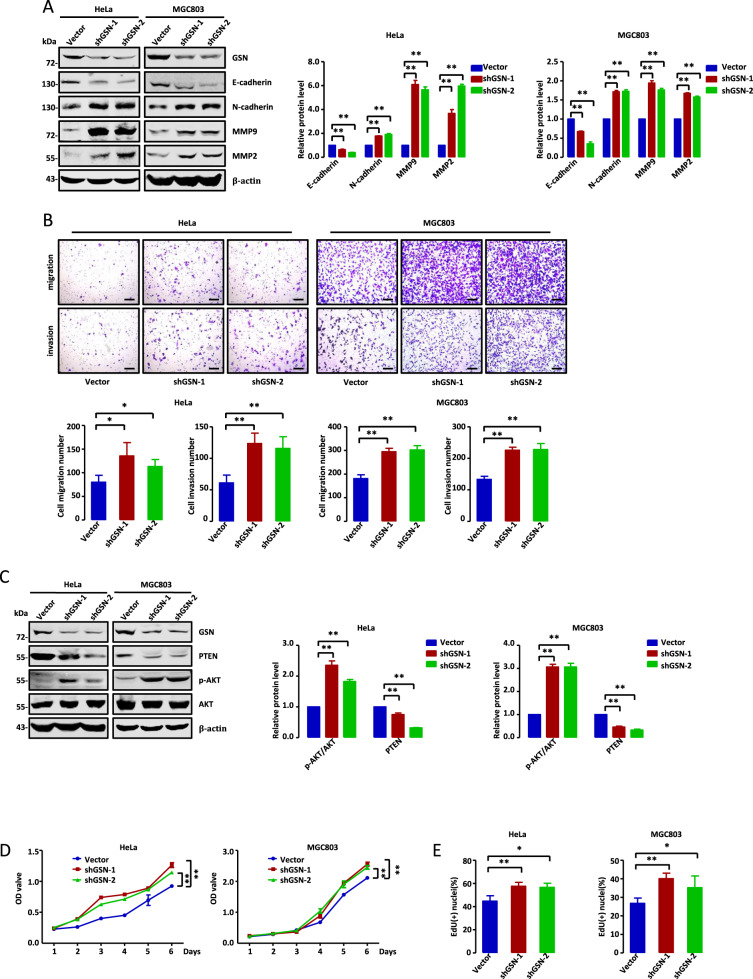
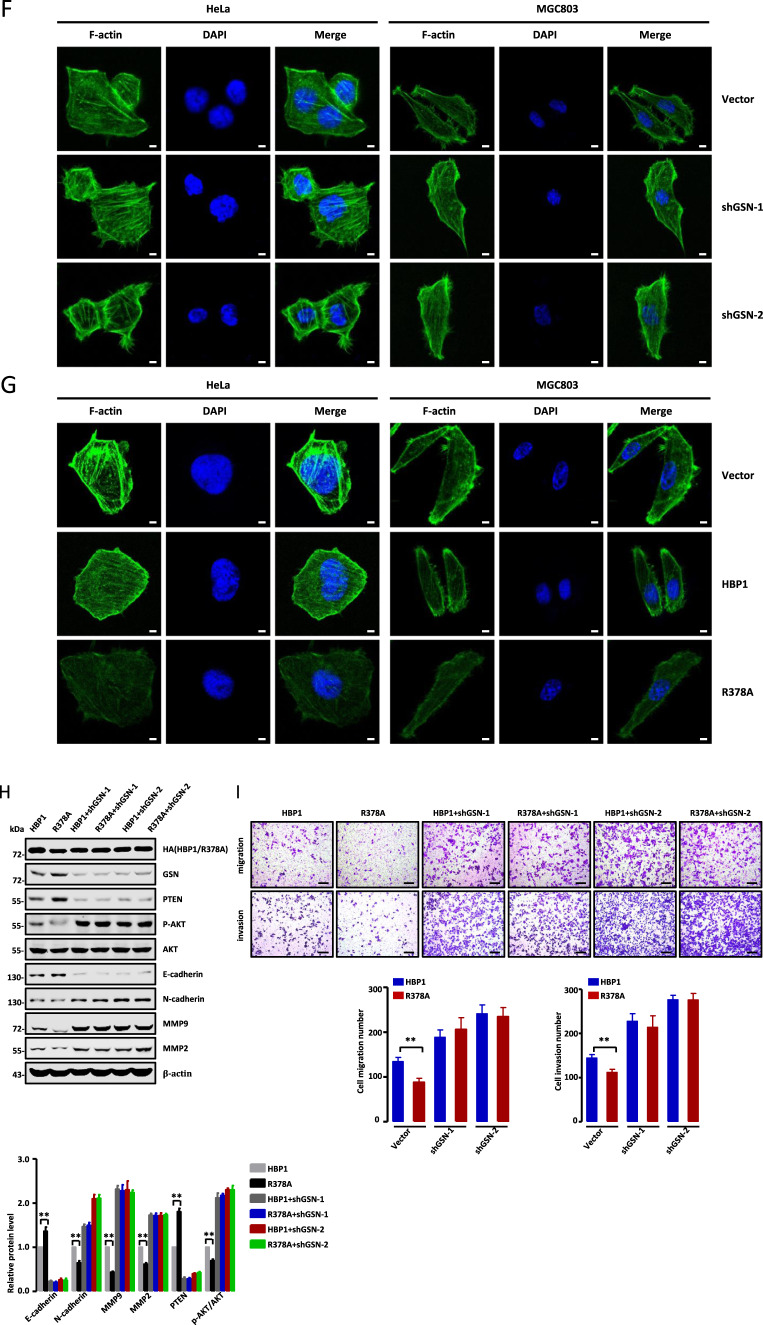
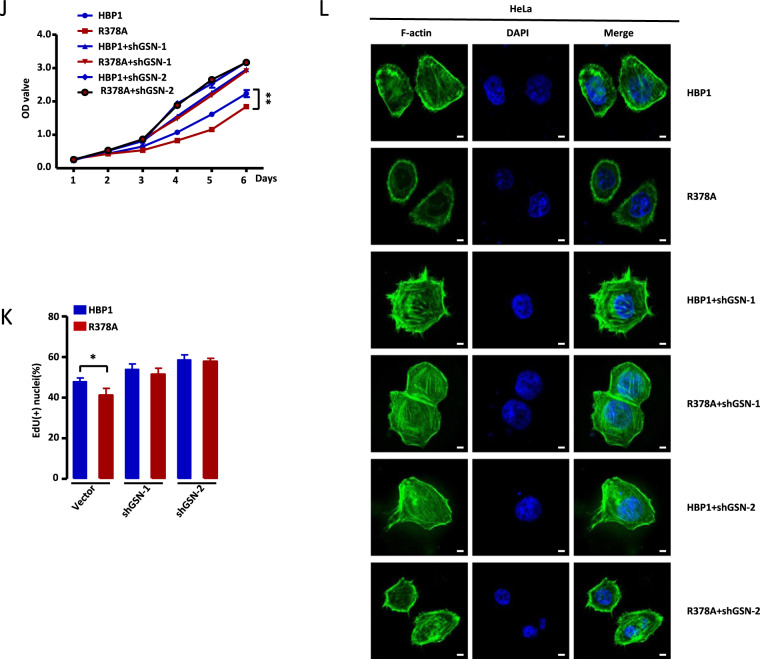
Fig. 6. Methylation of HBP1 promotes actin cytoskeleton remodeling by downregulating GSN.
A, C GSN knockdown inhibits cell migration and invasion of HeLa and MGC803 cells. A The protein levels of metastasis-related markers were measured by western blotting in HeLa and MGC803 cells transfected with empty vector, GSNshRNA1 or GSNshRNA2. C Transwell assays were performed to test the migratory and invasive potential of the cells above (n = 4, one-way ANOVA) (A). Scale bar, 200 µm. B, D, E GSN knockdown inhibits cell proliferation in HeLa and MGC803 cells. B The levels of proliferation-related proteins were measured by western blotting in the cells above (A). D MTT (n = 3, one-way ANOVA) and (E) EdU incorporation assays were performed to test the ability of cell growth in the cells above (n = 4, one-way ANOVA) (A). F GSN knockdown promotes filaments formation. F-actin were stained with phalloidin in the cells above (A). G Methylation of HBP1 alleviates its inhibition of filaments formation. HeLa and MGC803 cells were stably overexpressing empty vector, HBP1 or R378A and the levels of F-actin were analyzed by immunofluorescence intensity. Scale bar, 5 µm. H–K Methylation of HBP1 alleviates its inhibition of metastasis and growth of HeLa cells through down-regulating GSN expression. H HeLa cells stably expressing HBP1, R378A, HBP1 + shGSN-1, R378A + shGSN-1, HBP1 + shGSN-2, and R378A + shGSN-2 individually, the protein levels of metastasis-related and proliferation-related markers were measured by western blotting. I Transwell assays were performed to test the migratory and invasive potential of the cells above (n = 4, one-way ANOVA) (H). Scale bar, 200 µm. J MTT (n = 3, one-way ANOVA) and (K) EdU incorporation assays were performed to test the ability of cell growth in the cells above (n = 4, one-way ANOVA) (H). L Methylation of HBP1 promotes filaments formation by downregulating GSN. F-actin were analyzed by immunofluorescence intensity with the cells above (H). Scale bar, 5 µm. Date were the mean ± SD. *p < 0.05, **p < 0.01.


