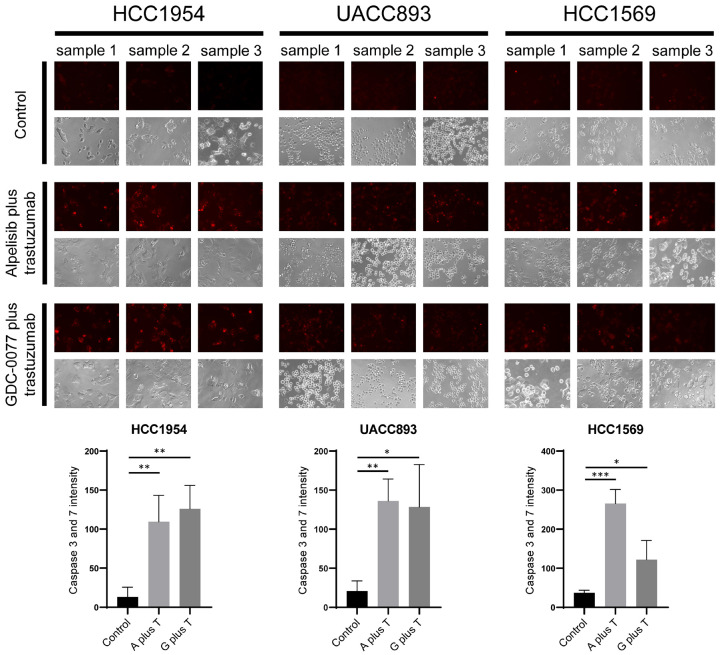
Figure 5.
Increased caspase 3 and 7 activities in trastuzumab-resistant breast cancer cells treated with PI3K inhibitors plus trastuzumab. Red fluorescence representes the activities of caspase 3 and 7 in treated cells. The concentration of drug was the same as that in the combination protocols used for western blot analysis. After treatment with the indicated agents, more red signal was observed in the combination groups compared with the control groups. The differences in caspase 3 and 7 intensity were statistically significant between the controls and PI3K inhibitors plus trastuzumab. The bar charts represent the mean caspase 3 and 7 intensity ± SD. P-value: *P<0.05, **P<0.01, and ***P<0.001. A plus T: alpelisib plus trastuzumab; G plus T: GDC-0077 plus trastuzumab.

