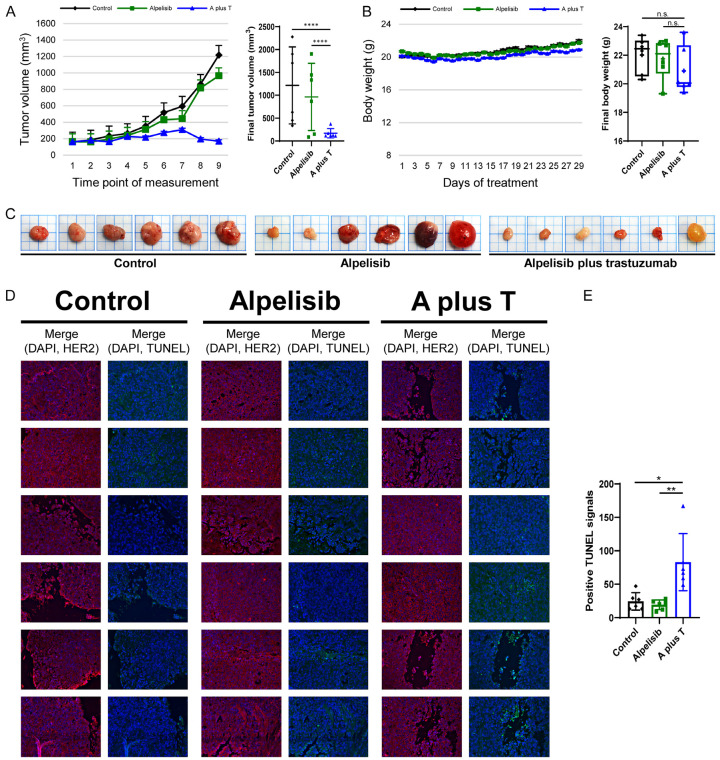
Figure 6.
Alpelisib plus trastuzumab causes prominent inhibition in the growth of HCC1954 xenografts and significantly increases apoptosis. A. Each plot indicates the mean value of the tumor volume. Final tumor volume was summarized and statistically analyzed. B. Each plot represents the mean value of body weight. Box charts show the distribution of final body weight. C. Images of the xenografts were taken immediately after harvesting. D. DAPI, HER2, and TUNEL signals were captured in each xenograft. Blue, red, and green fluorescence indicates DAPI, HER2, and TUNEL signals, respectively. E. Bar charts represent the mean value of positive TUNEL signals in the xenografts. Error bars represent the standard error in tumor volume and body weight, and SD in TUNEL signals. P-value: *P<0.05, **P<0.01, and ****P<0.0001. A plus T: alpelisib plus trastuzumab; n.s.: not significant.

