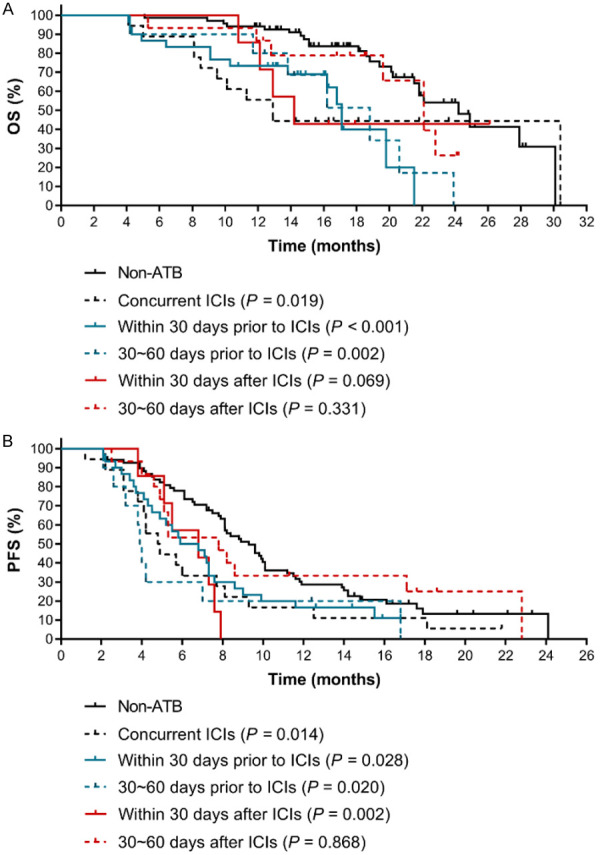
Figure 4.

The effects of time frame of exposure to ATBs on the clinical outcomes of ICIs therapy in advanced NSCLC patients. A. The Kaplan-Meier survival curves for OS. B. The Kaplan-Meier survival curves for PFS. The P value in bracket represents the statistical difference of the corresponding group compared with the Non-ATB group.
