
Figure 1.
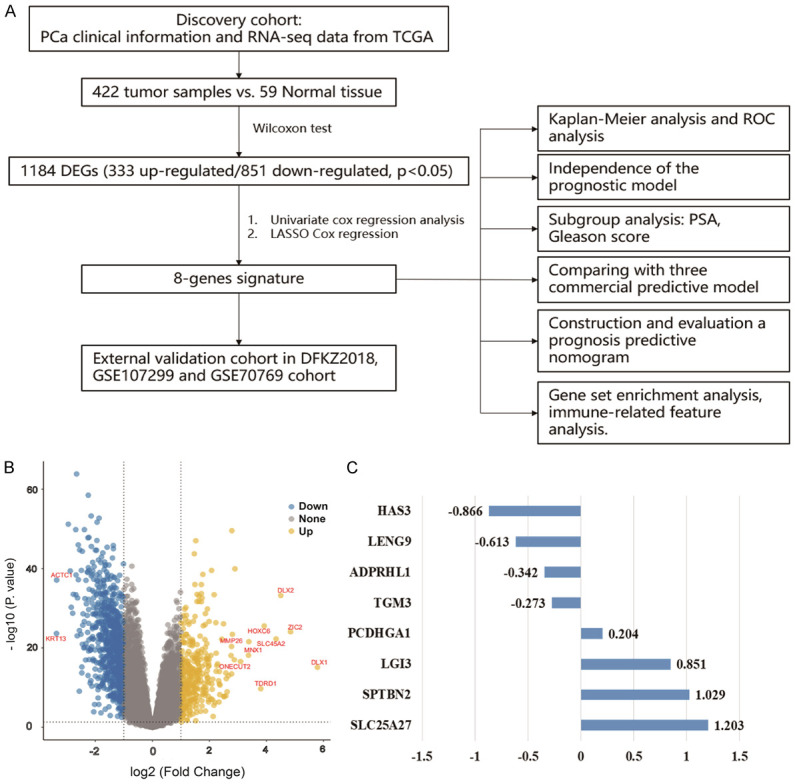
Screening BFS-correlated DEGs and establishing the 8-gene prognostic signature. A. The flow chart presents the process of establishing the gene signature and prognostic nomogram for PCa. B. The volcano plot displays the DEGs, which meet the criteria of a false discovery rate of <0.05, and |log2 fold change| >1. C. Eight BFS-correlated DEGs are shown with corresponding estimated regression coefficients. BFS: biochemical recurrence-free survival; DEGs: differentially expressed genes; PCa: prostate cancer.