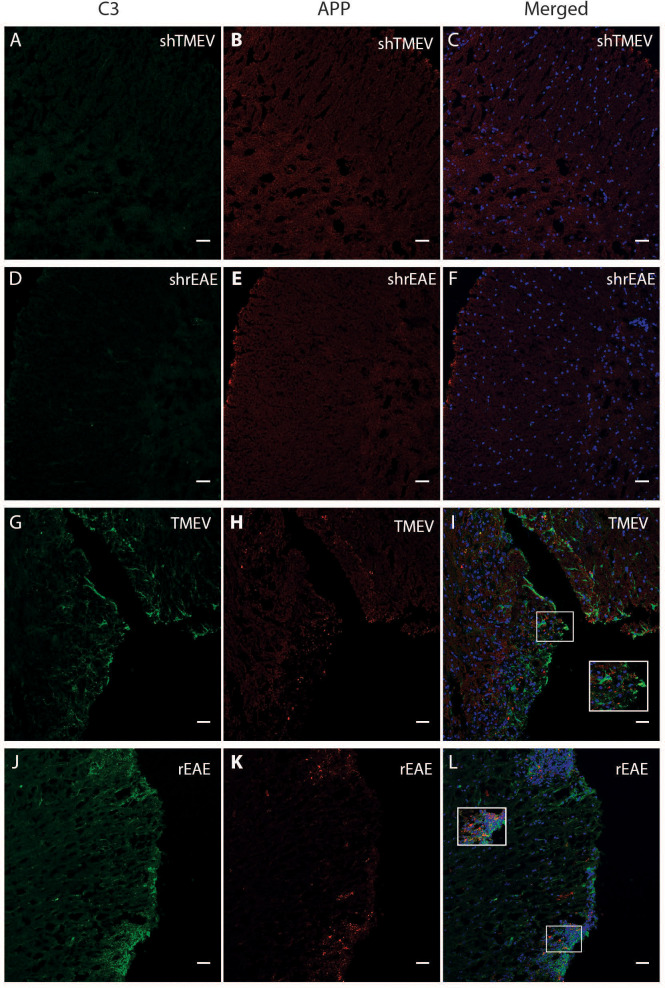
Figure 3.
Colocalization of C3 and APP in the spinal cord of TMEV-IDD and rEAE mice. TMEV-IDD and rEAE mice were necropsied at ~120 dpi (chronic stage) and ~15 dpimm (acute relapse), respectively. Spinal cords were harvested for immunohistochemical analyses of the complement component C3 (A, D, G, J) and the axonal damage marker APP (B, E, H, K) to link complement activation and disease pathology. As expected, age-matched sham controls (A–F) show no obvious C3 (green) or APP (red) staining. In contrast, C3 and APP colocalize in both models (I, L). Regions of interest were highlighted using inset images. Images are representative of 4-5 mice per group. Representative z stacks are shown and the scale bar = 100μM.

