Figure 4.
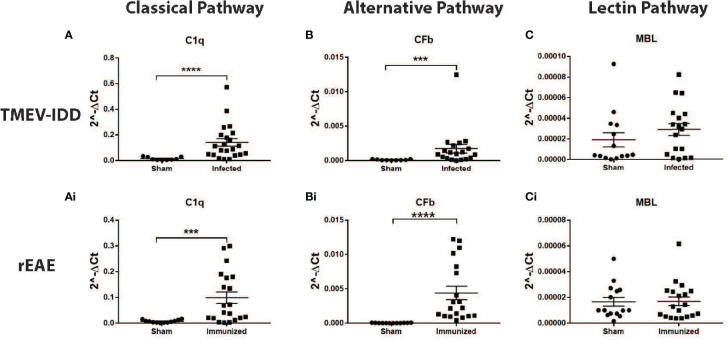
CNS gene expression of early complement components activating the three activation pathways of the complement cascade. Gene expression levels of C1q, CFb, and MBL were determined by rt-PCR in the spinal cords from TMEV-IDD mice (n = 26) at day ~120 post-infection and rEAE mice (n = 20) at day ~15 post-immunization. Age-matched sham controls were tested as reference group (n = 10 and n = 10, respectively). A significant upregulation of C1q and CFb was observed in TMEV-IDD (A, B) and rEAE (Ai, Bi) mice compared to their respective age-matched sham controls. MBL was not upregulated in either of the two models (C, Ci). Scatter plots display C1q (A, Ai), CFb (B, Bi) and MBL (C, Ci) in TMEV-IDD (A–C) or rEAE (Ai, Bi, Ci) mice with mean ± SEM for the group. Expression values are obtained by the ΔCt method, where GAPDH is utilized as control gene. Relative expression values (2-ΔCt) are plotted on the y-axis. Significant differences are indicated (***P<0.001 and ****P<0.0001) as determined by Mann-Whitney U-tests.

