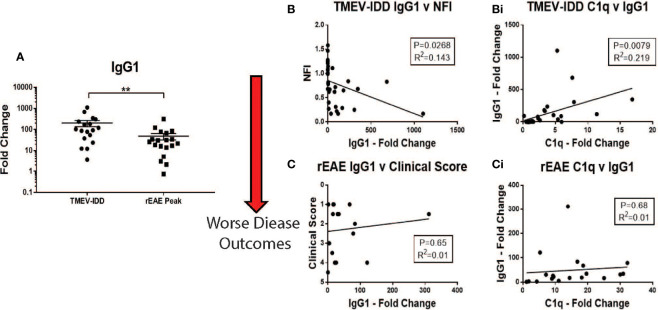
Figure 6.
Correlations between IgG1, C1q and disease outcomes in TMEV-IDD and rEAE. Gene expression of IgG1 and C1q was determined by rt-PCR in spinal cords from TMEV-IDD mice (n = 26) at day ~120 post-infection or rEAE mice (n = 20) at day ~15 post-immunization. (A) The scatter plot displays IgG1 expression in TMEV-IDD vs. rEAE mice with mean ± SEM for the group. Fold changes were calculated between diseased and age- matched sham mice. Significant differences are indicated by **(P < 0.01) as determined by Mann-Whitney U-test. (B, Bi) Linear regression analysis shows that during TMEV-IDD, high IgG CNS expression correlates with (B) a worse disease outcome and (Bi) higher levels of C1q. In contrast, (C, Ci) during rEAE IgG1 CNS expression does not correlate with the clinical outcome or C1q levels. P value and the coefficient of determination R2 are indicated in each regression.

