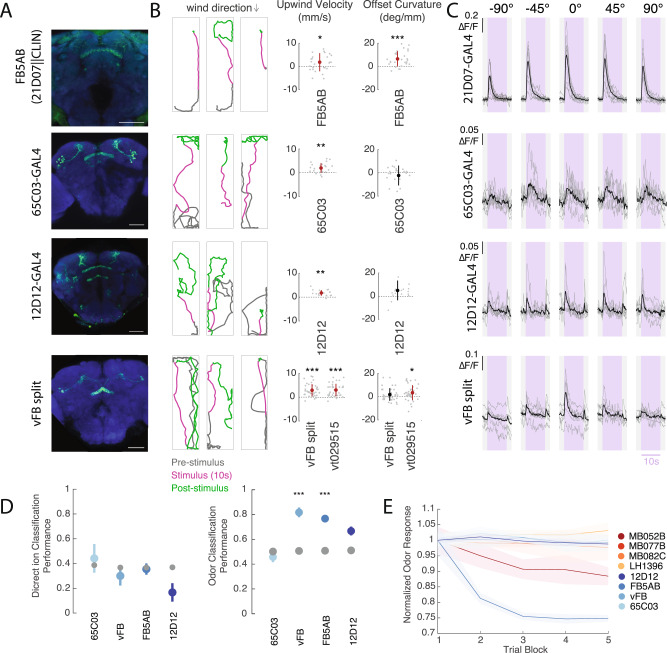
Fig. 4. Multiple FB tangential inputs respond to attractive odor and drive upwind movement.
A Confocal images of lines that showed FB responses to vinegar and drove upwind movement when activated. Each image shows stain for mVenus expressed with UAS-Chrimson in flies of the same genotype used for activation experiments (abbreviated genotypes shown at left). Scale bar 50 µm. B Example behavioral trajectories and quantification of upwind velocity and OFF curvature in each line shown at left. For FB5AB only light intensity was 34 µW/mm2. For all drivers, upwind velocity was quantified over 0–10 s after odor ON. Right: upwind velocity, OFF curvature 21D07||CLIN (N = 27): p = 0.0306, 8.1448e−05, 65C03 (N = 24): p = 4.1850e−04, 0.5841, 12D12 (N = 19): p = 1.8218e−04, 0.0055 vFB split (N = 38): p = 3.4153e−07, 0.1155, VT029515-GAL4 (N = 38): p = 4.3255e−07, 0.0024). C Calcium responses in each line shown at left in response to odor delivered from five different directions (as in Fig. 2E). Shaded purple region indicates odor period. Gray lines represent individual flies and black represents the mean across flies: 21D07 (N = 9), 65C03 (N = 7), 12D12 (N = 6), vFB split (N = 6 flies). D Performance of tree classifiers for wind direction (left) and odor presence (right) for FB tangential inputs. Gray dots represent classifiers trained with the same data and shuffled labels. Left: Performance of wind direction (left, center, right) classifier trained on the first 5 s of odor period. 65C03 p = 0.6450, vFB p = 0.4100, FB5AB p = 0.7882, 12D12 p = 0.0177. Right: Performance of odor versus wind classifier trained on first 5 s of wind and odor ON. 65C03(N = 7) p = 0.0203, vFB (N = 6) p = 1.0934e−06, FB5AB (N = 9) p = 2.8375e−04, 12D12 (N = 6) p = 0.0383. E Decay of fluorescence response to odor over trial blocks. The response to each trial block was calculated as the average odor response to 5 consecutive trials (each from one of the directions), averaged across all flies of a genotype. Response magnitude was normalized by the average response to the first block for each line. Shaded area represents standard error across flies. Statistics in B used two-sided Wilcoxon signed rank test and show mean ± STD. Classifiers in D used two-sided Student’s t-tests and show mean ± SEM. All statistics corrected using the Bonferroni method.

