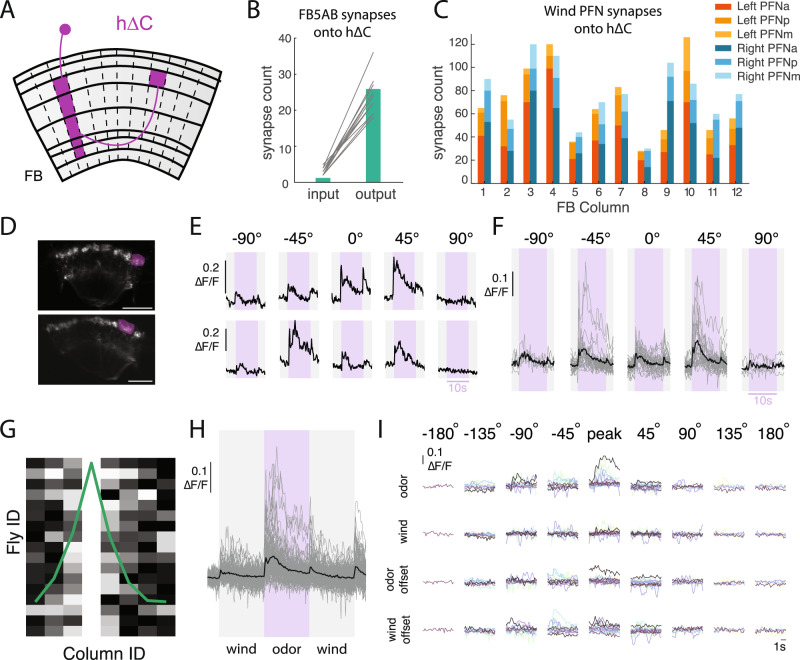
Fig. 5. h∆C neurons exhibit odor-modulated wind direction tuning.
A Schematic of an individual h∆C neuron (purple). 20 h∆C neurons tile the FB receiving input in layers 2–6 in a single column, and projecting halfway across the FB to output in layer 6. B Number of FB5AB synapses onto the input and output tufts of h∆C for every FB5AB-h∆C pair. C Number of synapses from left and right wind-sensitive PFNs (PFNa, PFNp, and PFNm, tuned to 45° left and right respectively) onto h∆C neurons, summed within columns. D 2-photon image of tdTOM expressed with GCaMP6f under VT062617-GAL4 which labels h∆C neurons. Purple ROI drawn around output tuft of a single column for analysis. Scale bar 25 µm. E Odor responses of two example flies/columns showing directionally tuned odor responses. F Summary of all measured odor responses >2STD above baseline across columns and flies. Gray traces represent individual columns and black traces represent mean across columns. G Directional responses are restricted to nearby columns: maximally responsive direction for each fly, where data are phase shifted so maximum columns align at column 4. Each fly normalized to maximum column response. H Summary of wind and odor responses for all measured responses >2STD above baseline across columns and directions. Responses to odor are stronger than those to wind ON, odor OFF and wind OFF (n = 87 responsive columns from N = 16 Flies). I Summary of wind and odor phase activity of maximally responsive column, aligned to maximally responsive direction. Data are shifted to be aligned to the maximal direction and each row represents different stimulus period. Each color represents a different fly (N = 16).

