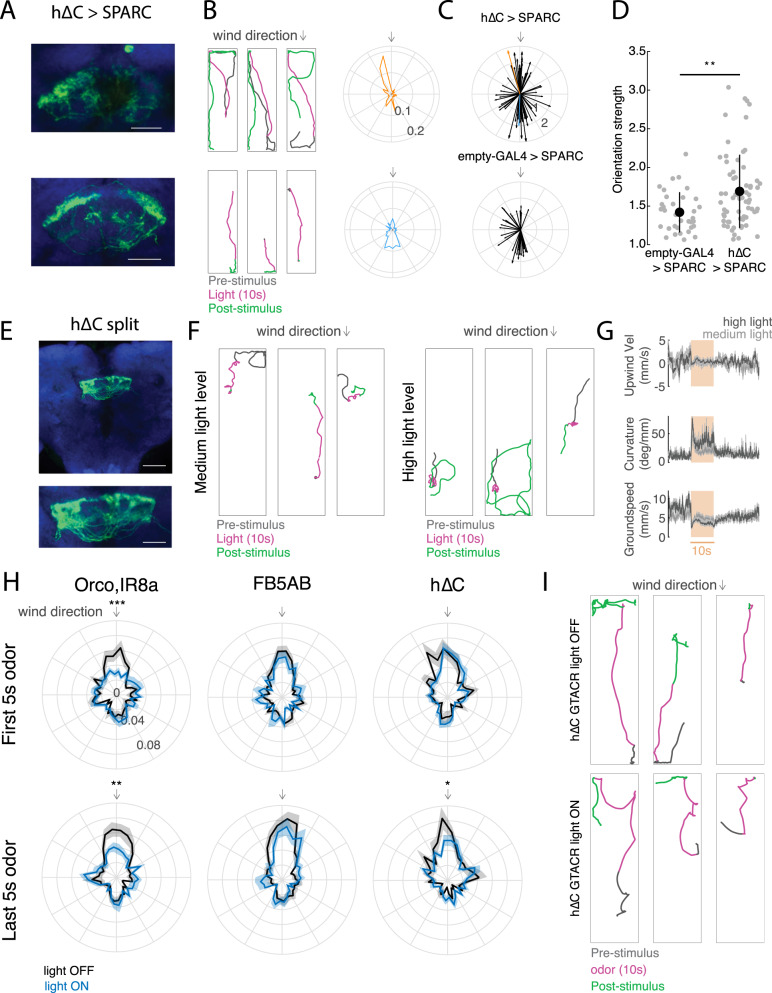
Fig. 6. Role of h∆C neurons in navigation behavior.
A Anatomical and behavior data from two representative h∆C > SPARC flies. Left: confocal images of tdTomato expressed with UAS-SPARC2-I-Chrimson. Scale bar 25 µm. B Behavior of two representative h∆C > SPARC flies from A, Left: example behavioral trajectories of flies before, during, and after optogenetic activation. Right: orientation histograms for each fly for the period 2–6 s after light ON. Radial axis represents probability. C Preferred orientations across all flies, where the vector direction corresponds to the preferred direction and the vector strength corresponds to the orientation index (see Methods, Fig. S6A). Top: h∆C > SPARC. Representative flies from A, B) are shown in orange and blue. Bottom: empty-GAL4 > SPARC. D h∆C > SPARC flies (N = 65) show stronger oriented walking than empty-GAL4 > SPARC2 flies (N = 34, see Fig. S6A for Methods, mean ± STD, two-sided ranksum test p = 0.0035). E Confocal image of hΔC split > Chrimson. Scale bar 50 µm (top), and 25 µm (bottom). F Example behavioral trajectories driven by hΔC split activation with 26 µW/mm2 light (left) or 34 µW/mm2 light (right). G Upwind velocity, curvature, and groundspeed (mean ± SEM) across hΔC split > Chrimson flies before, during, and after optogenetic activation using 26 µW/mm2 light (light gray, N = 32) or 34 µW/mm2 light (dark gray, N = 14). H Optogenetic inactivation of h∆C neurons using GtACR disrupts persistent upwind orientation. Each plot shows orientation histograms during light-evoked silencing (blue) compared to no-light control (black) for the first 5 s of odor (top) and last 5 s of odor (bottom). Shaded regions represent SEM. Optogenetic silencing of ORNs (orco,IR8a, N = 24) significantly reduces the probability of orienting upwind (±10°) during both phases (p = 9.2724e−04 early, 0.0090 late), while silencing of FB5AB (N = 32) does not (p = 0.3848 early, p = 0.3259 late). Silencing of h∆C neurons (N = 24) reduces upwind orientation only during the late phase (p = 0.8512 early, p = 0.0475 late). Two-sided t-test without correction for multiple comparisons. I Example behavioral trajectories in h∆C > GtACR flies in response to odor. Top: blue light off (non-silenced). Bottom: blue light on (h∆C neurons silenced).

