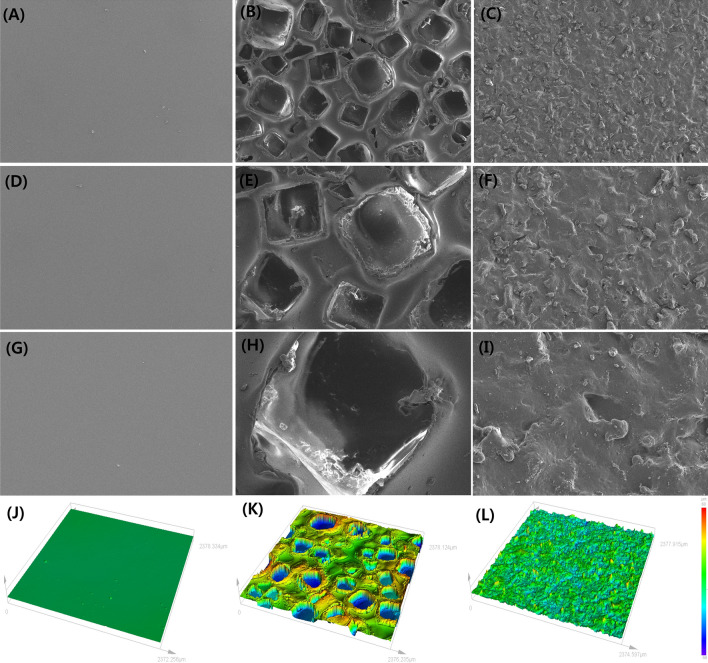
Figure 1.
Implant surface topography measured by scanning electron microscopy and 3D confocal laser scanning microscopy. Scanning electron microscopy images of the three types of implants with different topographies. (A) smooth type (top view × 50) (B) macrotexture type (top view × 50), (C) nanotexture type (top view × 50), (D) smooth type (top view × 100), (E) macrotexture type (top view × 100), (F) nanotexture type (top view × 100), (G) smooth type (top view × 300), (H) macrotexture type (top view × 300), (I) nanotexture type (top view × 300). 3D confocal laser scanning microscope images of three types of implants with different topographies. The roughness was measured to be 0.53 ± 0.14, 104.82 ± 7.49, and 6.53 ± 0.25 µm in the smooth, macrotexture, and nanotexture type implants, respectively: (J) smooth type, (K) macrotexture type and (L) nanotexture type.

