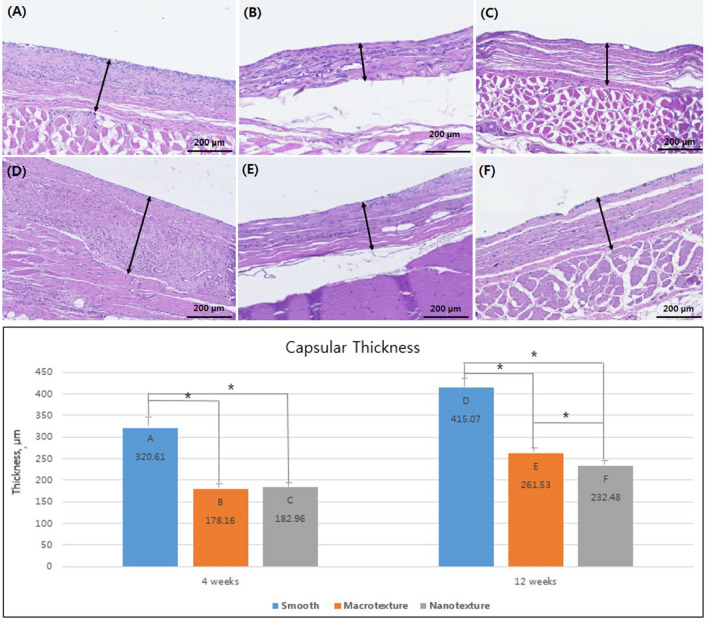
Figure 2.
Capsule formation of the three different types of silicone implants. Representative histologic sections of capsular tissues on the silicone implants showing capsular thickness (original magnification, × 100; scale bar = 200 μm). Sections were stained with hematoxylin and eosin. The bar graph shows the thickness of capsule. The black asterisks in the bars represent P values indicating significant differences between the groups (P < 0.05). (A) Group A (4 weeks, smooth type), (B) Group B (4 weeks, macrotexture type), (C) Group C (4 weeks, nanotexture type), (D) Group D (12 weeks, smooth type), (E) Group E (12 weeks, macrotexture type), (F) Group F (12 weeks, nanotexture type).

