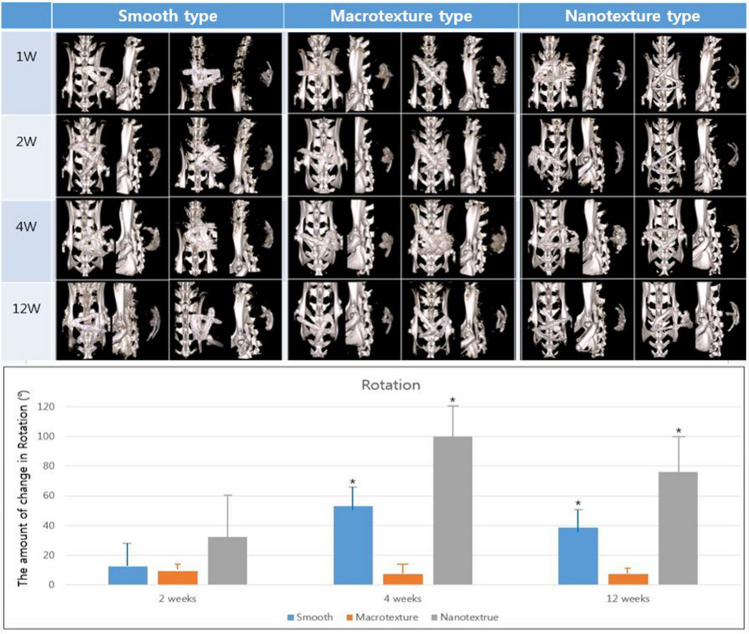
Figure 6.
Location of the three different types of silicone implants. Micro-computed tomography scans performed at 1, 2, 4, and 12 weeks after breast implant insertion. Three types of implants with different topographies (smooth, macrotexture, and nanotexture type). Bar graph showing the mean value of rotation. The amount of change in rotation was measured at 2, 4, and 12 weeks from the previous position. Black asterisks in the bars represent P values indicating significant differences between the groups (P < 0.05).

