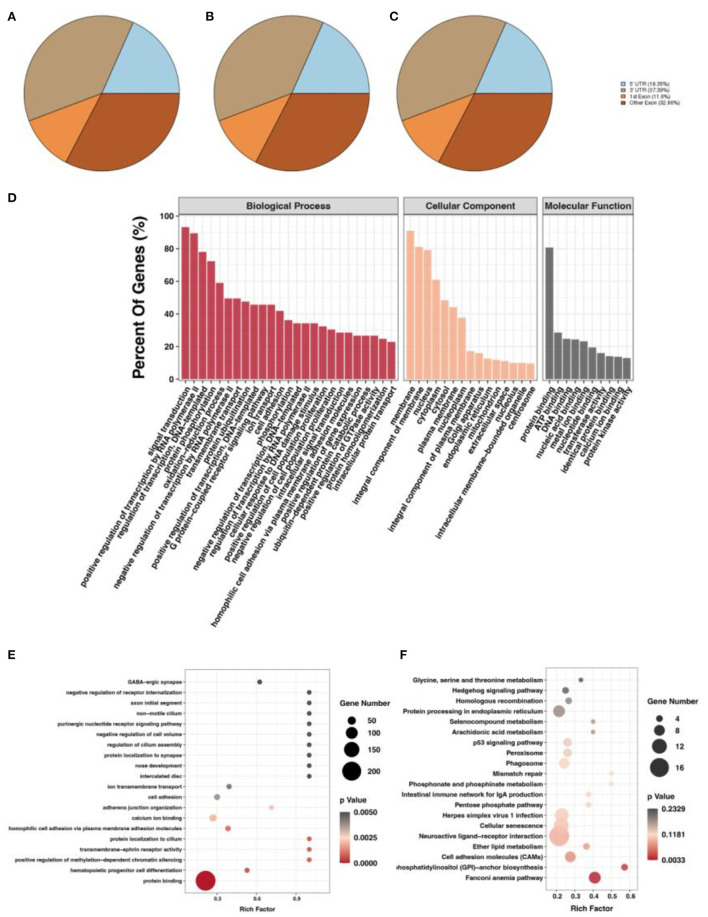
Figure 2.
m6A methylation peak screening and differential m6A peak analysis. (A) m6A methylation peaks at E10. (B) m6A methylation peaks at E19. (C) Overlapped m6A methylation peaks between E10 and E19. (D) GO enrichment barplot of DMGs. (E) GO enrichment scatterplot of DMGs. (F) KEGG enrichment scatterplot of DMGs.

