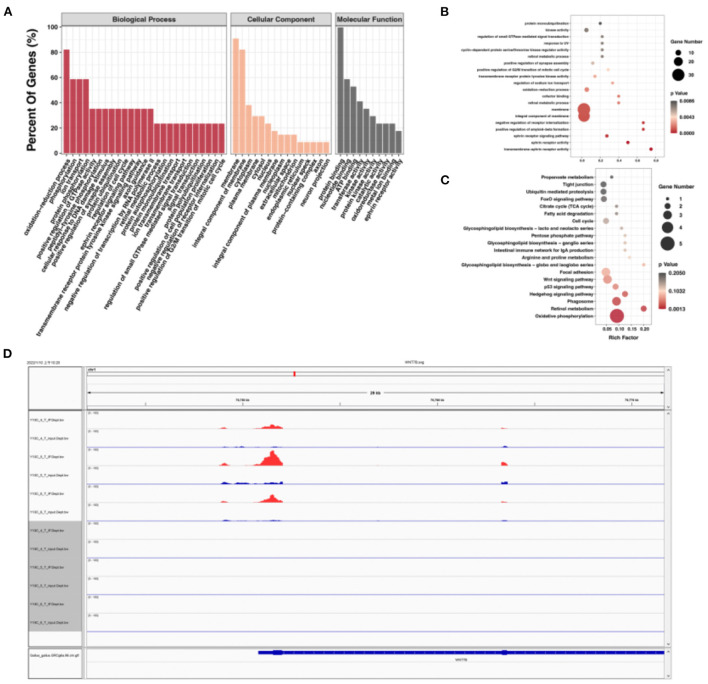
Figure 5.
Integrated analysis of m6A-seq, mRNA-seq, and miRNA-seq data. (A) GO enrichment barplot of miRNA-m6A-genes. (B) GO enrichment scatterplot of miRNA-m6A-genes. (C) KEGG enrichment scatterplot of miRNA-m6A-genes. (D) The visualization of m6A abundances in WNT7B mRNA transcripts in E10 and E19.

