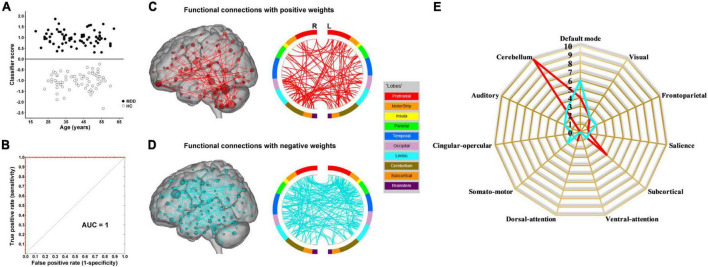
FIGURE 4.
Dynamic functional connectivity-based classification using fMRI data with global signal regression. (A) Scatter plot showing classification scores of all the subjects. (B) Receiver operating characteristic (ROC) curve of the classifier. (C) High-degree nodes (degree ≥ 3, larger spheres indicate nodes with higher degree) and their connections in the positive network. (D) High-degree nodes (degree ≥ 3) and their connections in the negative network. (E) Fingerprints of the 25 highest-degree nodes summarized by overlap with canonical neural networks.

