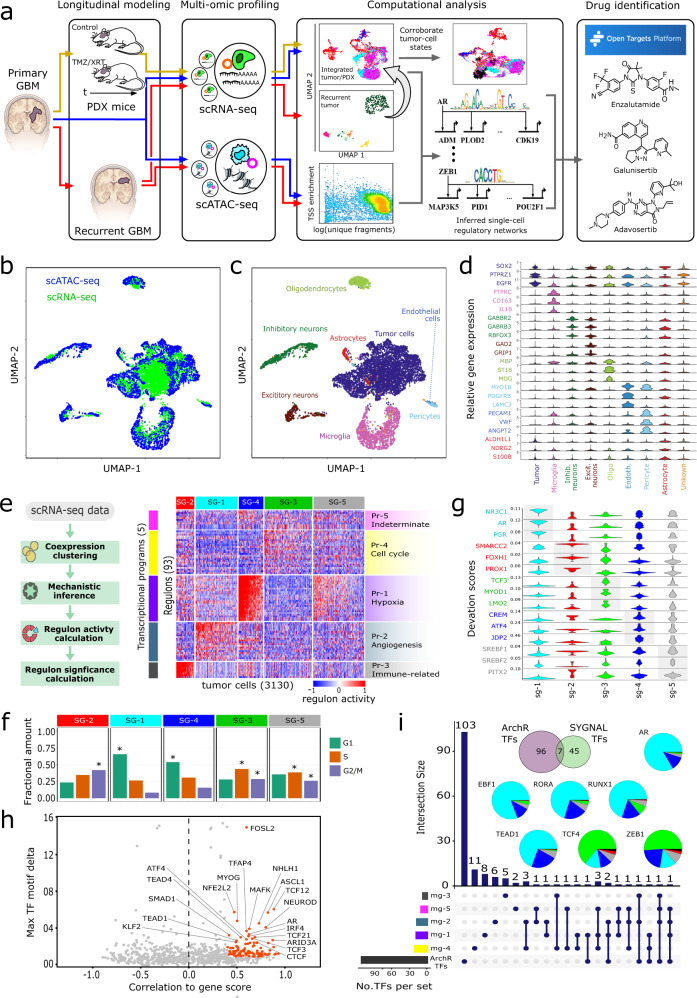
Fig. 1. Multi-modal single-cell characterization of UW7 primary tumor biopsy.
a Schema of overall modeling and analytical framework. UMAP projections of integrated snATAC-seq (4318) and snRNA-seq (3405) profiles. Color annotations indicate (b) data type or (c) cell type. d Violin plots of cell-type marker gene expression (log2(normalized counts + 1)). e scSYGNAL/MINER analysis of tumor cells (3130) identified from snRNA-seq profiles from UW7 primary tumor biopsy. Heatmap shows activity levels (z-scores) of regulons (rows) across tumor cells (columns). Regulons are grouped into transcriptional programs (Pr-X) and tumor cells sharing similar regulon/program activity profiles are grouped into transcriptional network states (SG-X). f Proportions of SG-X cells in specific cell-cycle phase. Asterisks indicate significant enrichment of cells in a particular cell-cycle phase (FDR p value ≪ 0.01). g Violin plots of standardized deviation accessibility scores (deviation scores), determined via snATAC-seq, of top three TF binding motifs per network state. h Scatter plot of TF motif deviation vs. correlation to inferred gene expression (gene score) via snATAC-seq profiles. Orange points indicate TF regulators whose deviation scores correlate with their corresponding inferred gene expression (gene score) values (correlation ≥0.4, FDR-adjusted p value ≤ 0.1) and have a maximum inter-sample group deviation score difference in the upper 50% quantile. Labeled TFs have maximal radial distance from the plot origin. i Upset plot outlines number of TFs identified from scSYGNAL and ArchR analysis and number of common TFs shared across all combinations of transcriptional programs and ArchR TF sets. Pie charts indicate the composition of transcriptional network states associated with a positive deviation score for each consensus TFs.

