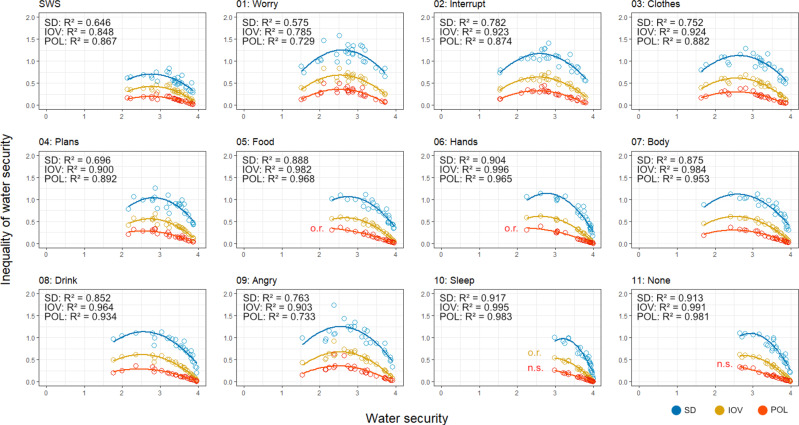
Fig. 3. Inverted U-shaped relationship between different water security and inequality indices.
Water security indices include composite WS score and the 11 comprising items, and inequality indices include SD, IOV, and POL. Sample size = 28. A more stringent two-sided p-value threshold at 0.01 was used to counteract the potential problem of multiple comparisons. n.s. denotes the quadratic regression model is not statistically significant while o.r. denotes the extremum point is out of the range of the available data. See Supplementary Table 4 for details.

