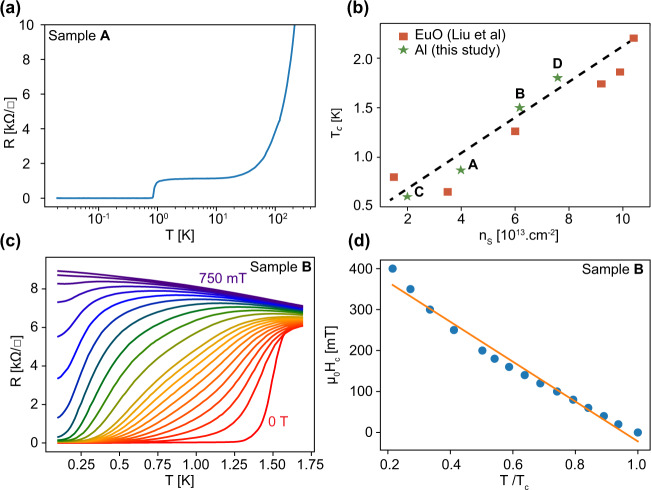
Fig. 2. Magneto-transport characterization.
a Sheet resistance of sample A as a function of temperature (log scale) showing a superconducting transition at Tc ≃ 0.9 K. b Summary of the superconducting critical temperature as a function of the carrier density for all samples studied in this work compared with results from ref. 6. c Sheet resistivity of sample B as a function of temperature for increasing magnetic fields between 0 and 750 mT. d Perpendicular critical magnetic field defined by a 50% drop of the normal-state resistance measured at T = 1.65 K. The orange line corresponds to a linear fit with the Ginsburg Landau formula.

