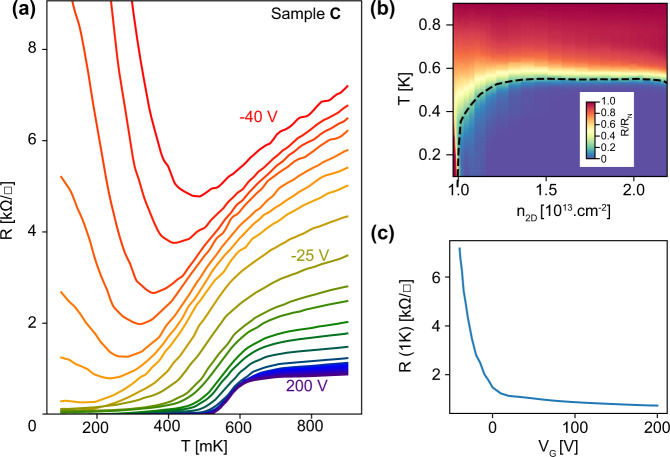
Fig. 3. Electric field effect and superconducting phase diagram.
a Temperature dependence of the sheet resistance of sample C for different values of the back-gate voltage in the range −40 to 200 V. b Normalized sheet resistance in color scale as a function of the carrier density extracted from Hall measurements and temperature. The dashed line indicates the critical temperature defined by an 80% drop of the resistance with respect to the normal resistance RN at T = 0.9 K. c Sheet resistance at 0.9 K as a function of the back-gate voltage.

