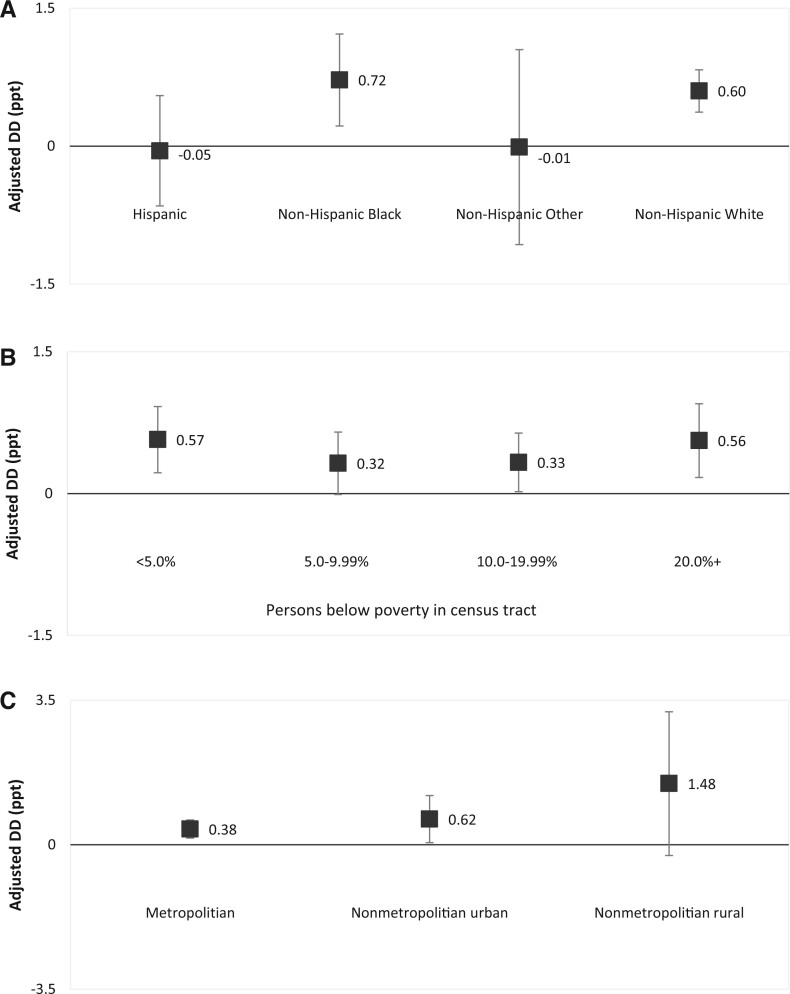
Figure 3.
Associations of Medicaid expansion status with increases in 2-year overall survival by sociodemographic factors among newly diagnosed cancer patients, North American Association of Central Cancer Registries 2010-2016. DD and their 95% confidence intervals are presented by (A) race and ethnicity, (B) census tract–level poverty, and (C) rurality. Non-Hispanic Other included American Indian or Alaska Native, Asian or Pacific Islander, and unknown. Adjusted DD was calculated with flexible parametric survival models adjusting for age group, sex, race and ethnicity, rurality, and region when applicable. DD = difference-in-differences, measuring the association between Medicaid expansion and changes in 2-year overall survival; ppt = percentage point.

