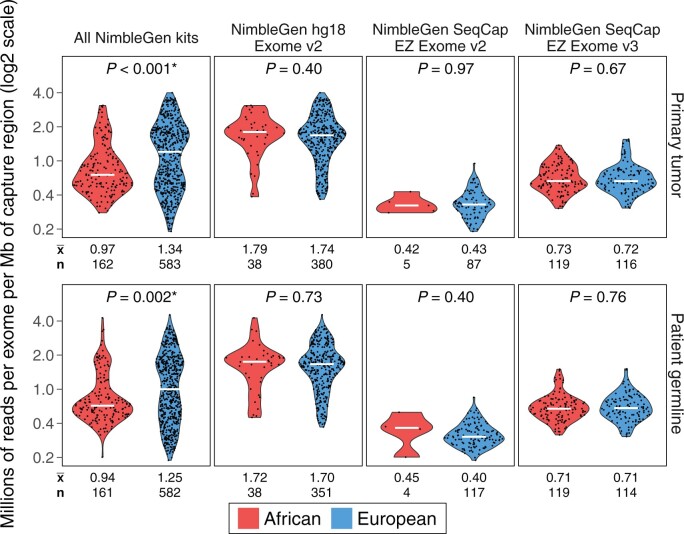
Figure 2.
Number of reads per exome per megabase of capture region in The Cancer Genome Atlas breast cancer patients. Sequencing depths are illustrated as the number of reads per exome per megabase of the capture region. From left to right are sequencing coverage data from all individuals captured by NimbleGen kits, followed by those captured by NimbleGen hg18 Exome v2, NimbleGen SeqCap EZ Exome v2, and NimbleGen SeqCap EZ Exome v3 kits. Mann-Whitney U test 2-sided P values are shown for all comparisons. The earlier sample batch using the older NimbleGen hg18 Exome v2 kit was sequenced at 1.70-1.78 million reads per megabase of targeted region on average, which was statistically significantly higher compared with exome batches captured by the 2 more recent kits: NimbleGen SeqCap EZ Exome v2 and v3. Sequencing depths did not differ between ancestrally African and European exomes processed by the same capture kit. Patient allocations by race were unbalanced among 3 exome capture kits: ancestrally European patients were statistically significantly enriched, whereas ancestrally African patients were statistically significantly underrepresented (2-sided P < .001; 2-sample proportions z test) in the NimbleGen hg18 Exome v2 batch in which the sequencing depths were statistically significantly higher.

