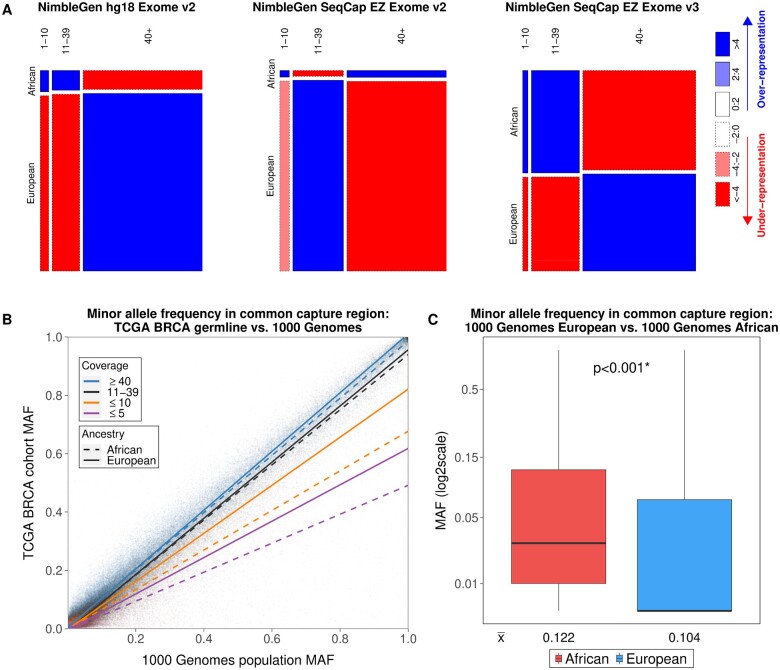
Figure 3.
Proportions of germline exome positions from ancestrally African and European patients at different levels of coverage in The Cancer Genome Atlas (TCGA) breast cancer (BRCA) dataset. A) Mosaic plots of read coverage levels. The common target regions of the 3 NimbleGen exome capture kits were included in the analyses. For all 3 sample batches, the low-coverage positions (1-10 reads) were enriched in ancestrally African exomes, whereas the high-coverage positions (≥40 reads) were enriched in ancestrally European exomes in the NimbleGen hg18 Exome v2 and NimbleGen SeqCap EZ Exome v3 kits. B) Low coverage resulted in underdetection of germline variants in both ancestrally African and European patients but was worse for ancestrally African patients. The variant minor allele frequencies (MAF) from TCGA BRCA patients were compared with those from the 1000 Genomes Project. For the variants located at positions with medium (11-39 reads) or high (≥40 reads) coverage, the agreement of the MAFs between 1000 Genomes Project and TCGA BRCA cohort was high, with the slopes of the corresponding regression lines close to 1. The MAFs of the variants with low coverage (1-10 reads) in TCGA BRCA cohort were statistically significantly lower compared with population MAFs from the 1000 Genomes Project in both ancestrally European and African patients, and the slopes of their regression lines substantially deviated from 1 and were substantially lower for ancestrally African compared with European exomes. C) The exome capture regions are more polymorphic in ancestrally African populations. Germline variant MAFs from the 1000 Genomes Project were statistically significantly higher (Mann-Whitney U test 2-sided P < .001) in the African population than those in the European population at the 280 714 variant positions overlapping with the NimbleGen common capture region. The horizonal lines inside the boxplot are median MAF values for either population, and the numbers below each boxplot denote the mean. BAC = B allele concentrations.

