Figure 1.
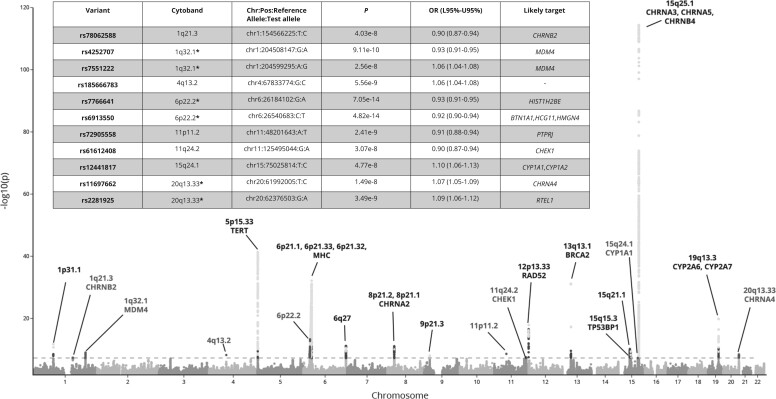
Manhattan plot of the meta-analysis of the genome-wide by proxy (GWAx) with genome-wide association study (GWAS) into lung cancer. The Manhattan plot displays the results of the meta-analysis of the GWAx (48 843 proxy patients and 195 387 controls without a family history of any cancer) and the Transdisciplinary Research In Cancer of the Lung GWAS (29 266 patients and 56 450 controls) with already identified and novel loci noted with the likely candidate gene name presented. The table represents the newly 11 independent loci across 8 distinct cytoband regions (sites with 2 independent hits are denoted by * within the cytoband column). The x-axis is the chromosome position across the autosomal chromosomes, and the y-axis contains the association level displayed as the -log10(P value), derived by a multivariate logistic regression model. The dotted line displays the genome-wide significance threshold (5 x 10⁻⁸). L95% = lower bound confidence interval; OR = odds ratio; U95% = upper bound confidence interval.

