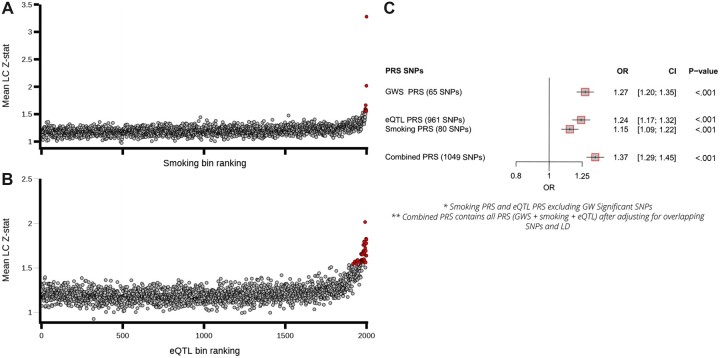
Figure 3.
Germline polygenic risk score construction using smoking and eQTL related SNPs and performance testing within the UK Biobank lung cancer cohort. A) The mean lung cancer association statistics calculated by variant bins (100 variants per bin) ranked by partial least squares (PLS) components. Variants (clumped on LD based on lung cancer P values) were ranked based on PLS components for smoking propensity (Component1_smoking, top) and eQTLs (Component1_eQTL, [B]) (x-axis) and plotted against the mean lung cancer Z statistics calculated across variants in each bin (y-axis). Bin values that exceed 3 SDs from the mean are noted, with the excess observed (number of bins smoking propensity = 9, number of bins eQTL = 37) implying that the variants within these bins are enriched for LC-susceptibility alleles. C) A forest plot of the performance of the constructed PRSs in comparison to the PRS based on the 65 GWS independent loci as a baseline which included array type, sex, age of recruitment and the first 5 principal components from genetic-inferred ancestry). CI = confidence interval; eQTL = expression quantitative trait loci; LC = lung cancer; LD = linkage disequilibrium; GWS = genome-wide significant; OR = odds ratio; PRS = polygenic risk scores; SNP = single nucleotide polymorphism.

