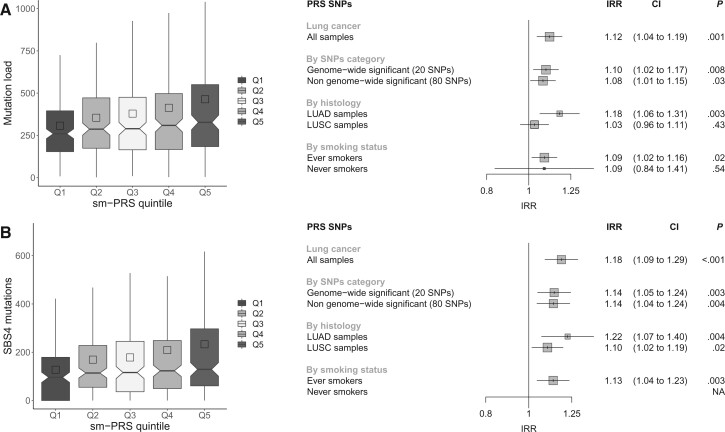
Figure 4.
Polygenic risk scores for smoking (smPRS) associations with total number of mutations and mutations attributable to SBS4 in TCGA cohort. A) Associations with total number of mutations. B) Associations with SBS4 mutations. The left panels represent the distribution of the number of mutations in the smPRS quintiles. The right panels correspond, respectively, to the forest plots of smPRS associations with total mutational burden (panel A) and SBS4 mutations (panel B). For each PRS, the association was tested 1) in all lung cancer patients when considering all SNPs in the smPRS SNPs selection, 2) in all lung cancer patients when considering different subsets of SNPs in the PRS computation, 3) stratifying by histology, and 4) stratifying by smoking status. CI = confidence interval; IRR = incidence rate ratios; LUAD = Lung adenocarcinoma; LUSC = Lung Squamous Cell Carcinoma; NA = Not available; Q = quintile; TCGA = The Cancer Genome Atlas; SNP = single nucleotide polymorphism.

