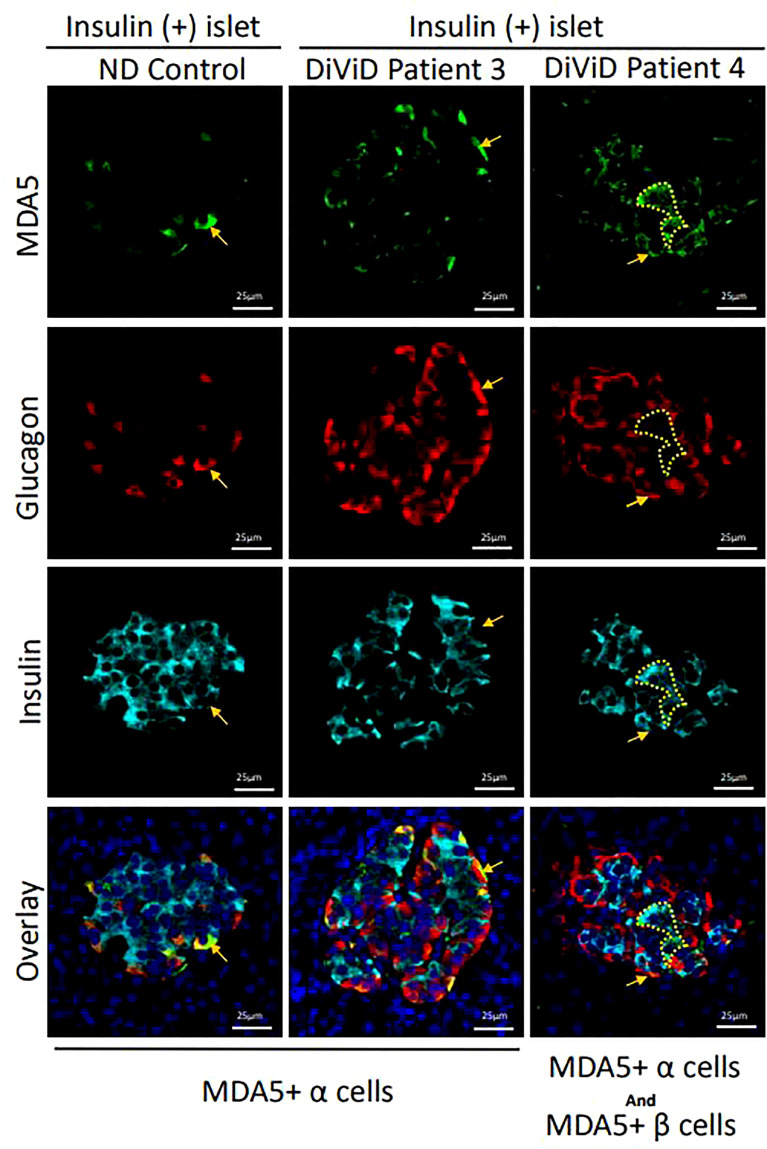
Figure 3.
Micrographs showing immunofluorescent images of a representative islet from an individual without diabetes (ND; column 1) and from two DiViD patients with diabetes (columns’ 2-3). MDA5+ alpha cells are indicated with arrows and MDA5+ beta cells with dotted lines (columns 2 & 3). Green, MDA5; Red, glucagon; Cyan, Insulin; Blue, DAPI. Scale bars, 25um.

