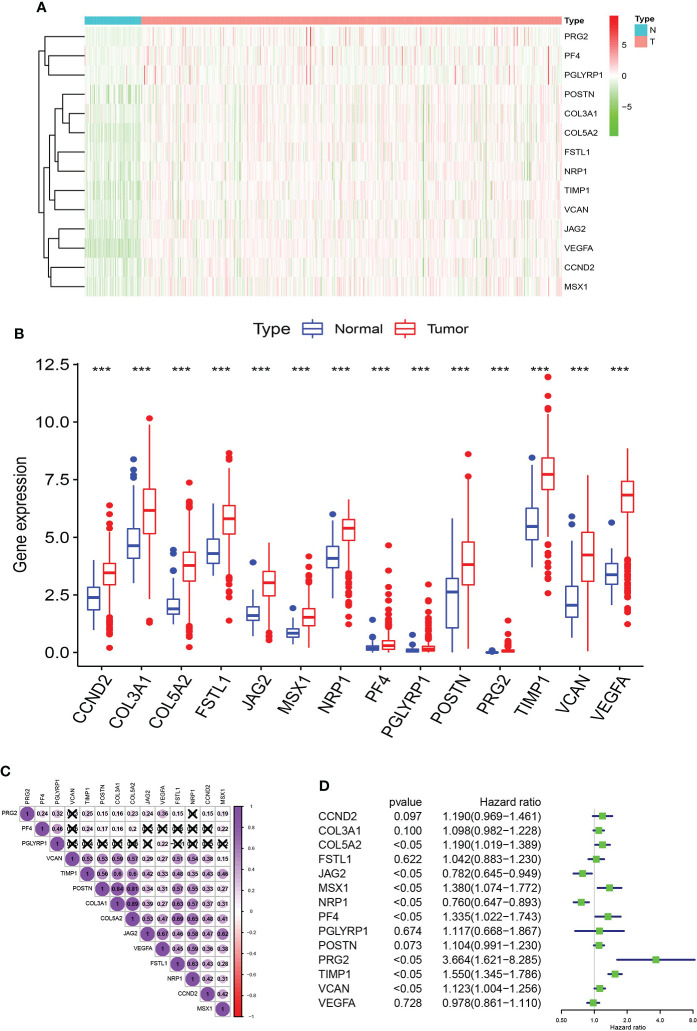
Figure 1.
AAGs screening. Heat map (A) and box plot (B) showing the expression distributions of differentially expressed genes between KIRC and normal samples of the AAGs. (C) Correlation analysis of the 14 AAGs. (D) Univariate Cox regression analysis of 14 AAGs. The meaning of the symbol *** is p<0.001.

