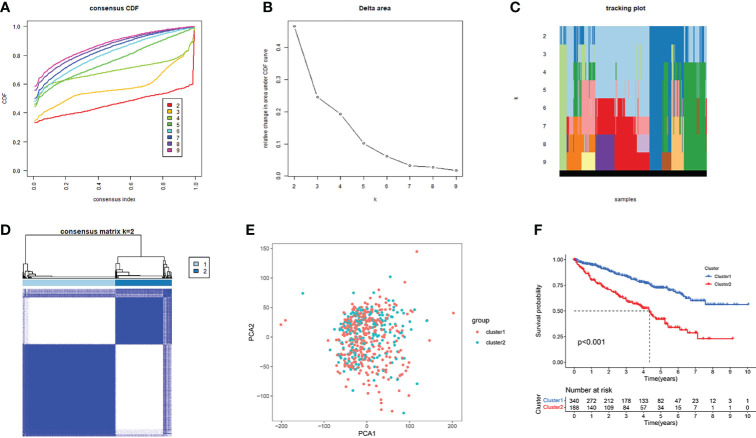
Figure 4.
Consensus clusters by 23 AAG-related lncRNAs. (A) Consensus clustering cumulative distribution function (CDF) for k = 2 to 9. (B) Relative change in area under the CDF curve for k = 2 to 9. (C) Tracking plot for k = 2 to 9. (D) Consensus clustering matrix for k = 2. (E) Principal component analysis of the gene expression profiles. (F) Kaplan–Meier curve showing a different prognosis between the two clusters.

