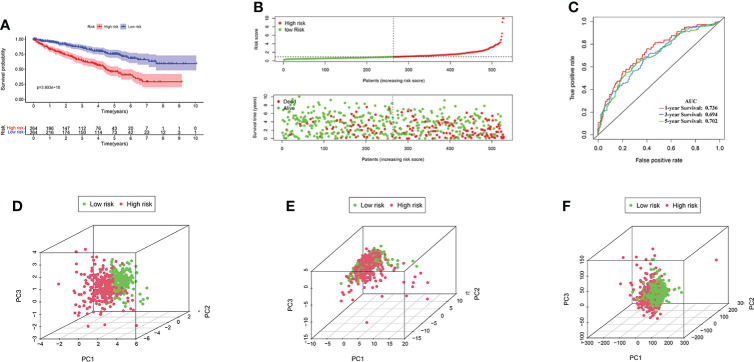
Figure 5.
(A) KIRC patients in the high-risk group had a worse overall survival than the low-risk group by Kaplan–Meier curves. (B) The distribution of risk score and survival times of KIRC patients. (C) Receiver operating characteristic analysis of the angiogenesis-associated gene (AAG)-related lncRNA prognostic signature for predicting the 1/3/5-year survival. (D) Principal component analysis among high- and low-risk groups based on the four prognostic AAG-related lncRNA sets. (E) PCA among high- and low-risk groups based on all the AAG-related lncRNA sets. (F) PCA among high- and low-risk groups based on the whole gene sets.

