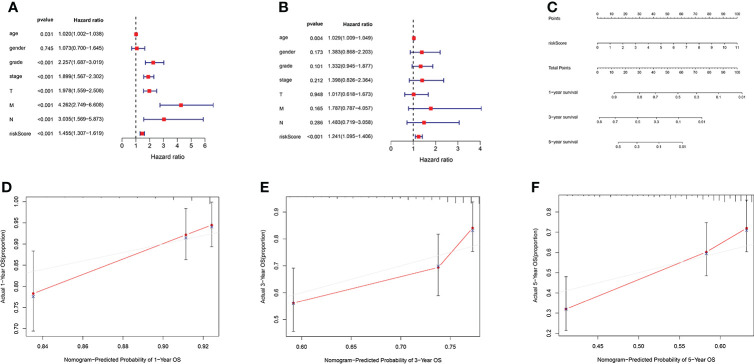
Figure 6.
(A) Forest plot for univariate Cox regression analysis showing that grade, stage, T stage, M stage, N stage, and risk score were prognostic risk-related variables (p < 0.001). (B) Forest plot for multivariate Cox regression analysis showing that only the risk score was the independent prognostic factor (p < 0.001). (C) Nomogram integrating the risk score of four AAG-related lncRNAs. (D–F) Calibration curve analysis of the nomogram for predicting the 1-, 3-, and 5-year overall survival in The Cancer Genome Atlas dataset.

