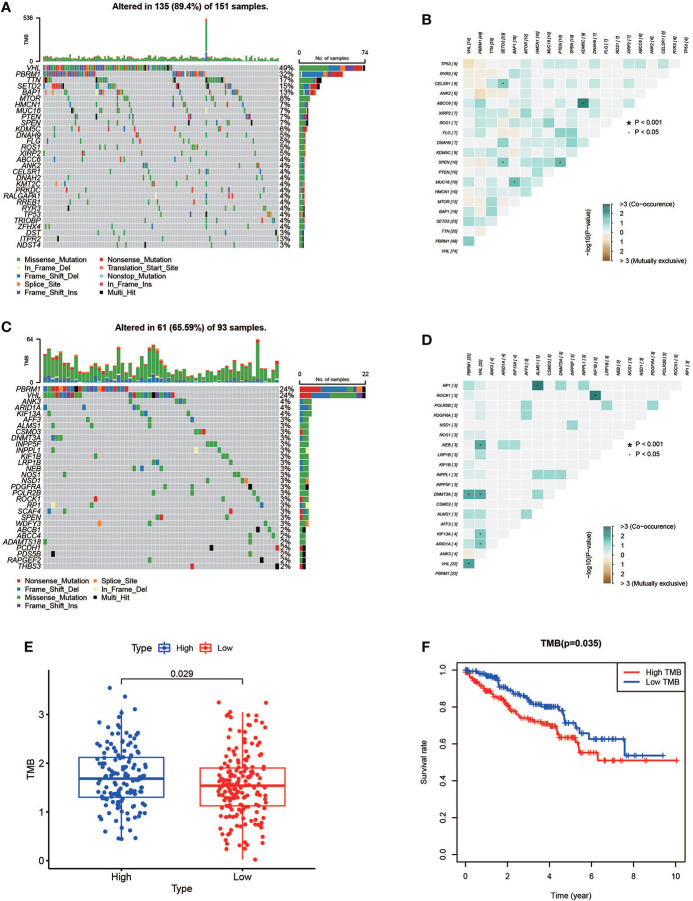
Figure 9.
Mutation profile and relationship between tumor mutation burden (TMB) and risk score. (A, B) Mutation profile of the high-risk group and interaction among 20 most frequent mutant genes. (C, D) Mutation profile of the low-risk group and interaction among 20 most frequent mutant genes. (E) Relationship between TMB and risk score. (F) Association of TMB and overall survival in KIRC patients.

