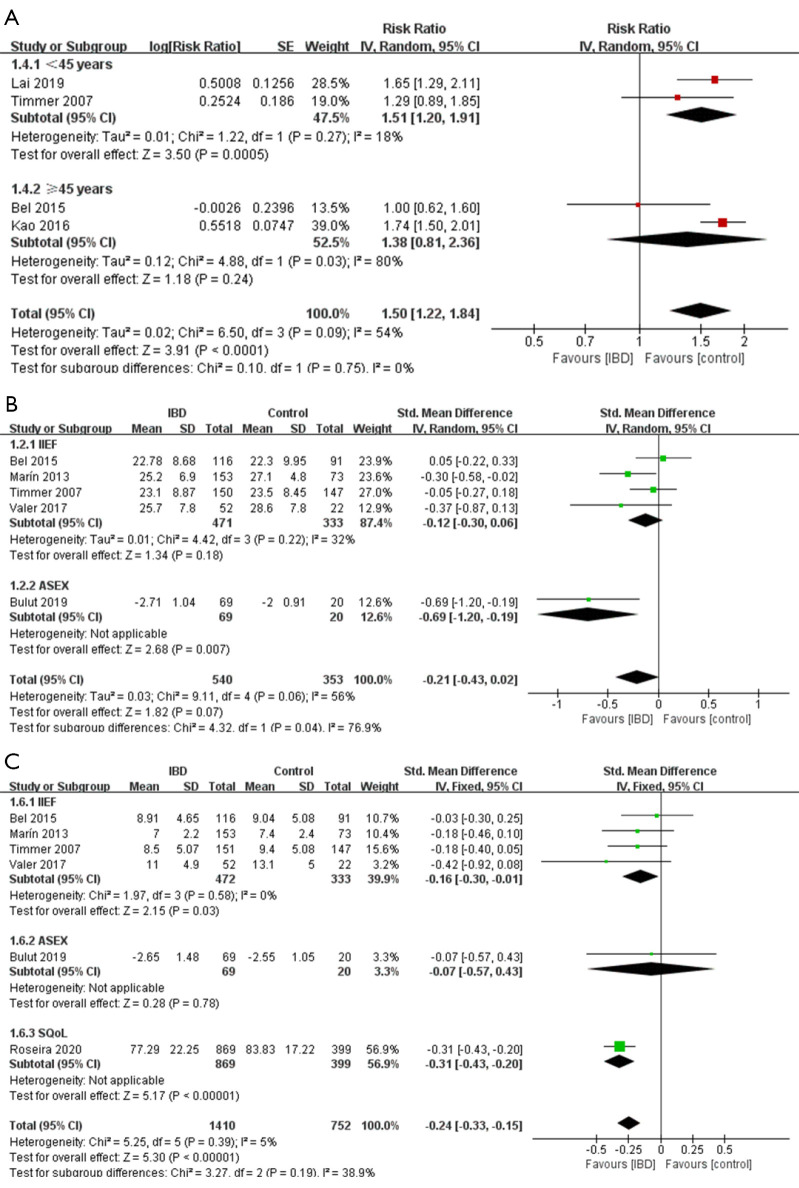
Figure 3.
Forest plot showing subgroup analysis results of the prevalence of ED (A), the erectile function scores (B), and the “satisfaction and quality” scores (C) for male. Controls represent male individuals without inflammatory bowel diseases. SD, standard deviation; IIEF, International Index of Erectile Function; ASEX, Arizona Sexual Experience Scale; SQoL, Sexual Quality of Life Questionnaire; ED, erectile dysfunction.

