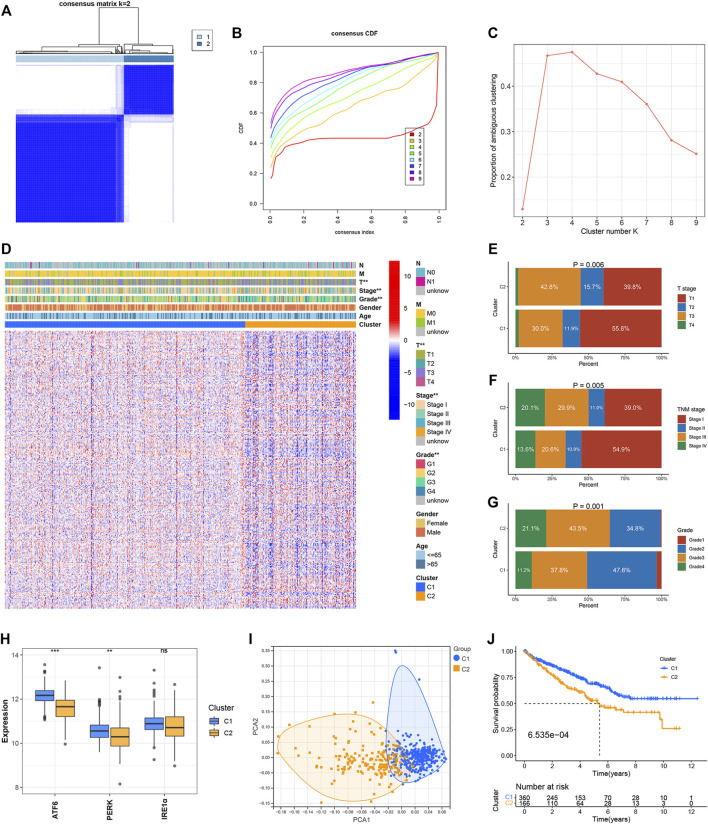
FIGURE 1.
Identification of ER stress-related clusters of ccRCC. (A) Consensus cluster matrix of ccRCC samples when k = 2. (B) CDF curves for k = 2–9. (C) PAC scores recorded at different K values. (D) Heatmap of ER stress-related genes and distribution of clinical parameters between two clusters. (E) Distribution of the T stage in the two clusters. (F) Distribution of the TNM stage in the two clusters. (G) Distribution of tumor grade in the two clusters. (H) Expressions of ATF6, PERK, and IRE1α in the two clusters. (I) PCA for two ER stress-related clusters. (J) OS of two ER stress-related clusters. ∗ p < 0.05, ∗ ∗ p < 0.01, ∗ ∗ ∗ p < 0.001.

