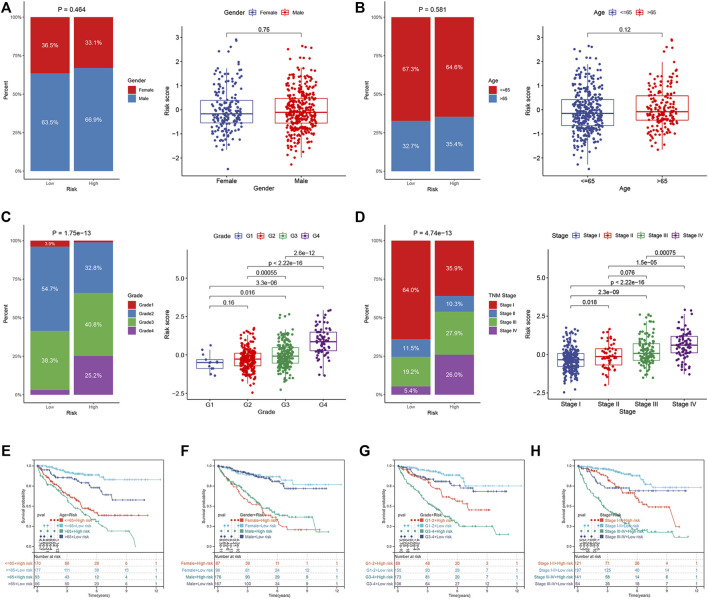
FIGURE 7.
Correlation between ER stress-related prognostic risk model and clinical parameters in the TCGA dataset. (A–D) Distribution of risk scores stratified by gender, age, tumor grade, and TNM stage, and composition of clinical parameters between high- and low-risk groups. (E–H) OS of the high- and low-risk groups combined with different clinical parameters in the TCGA dataset.

