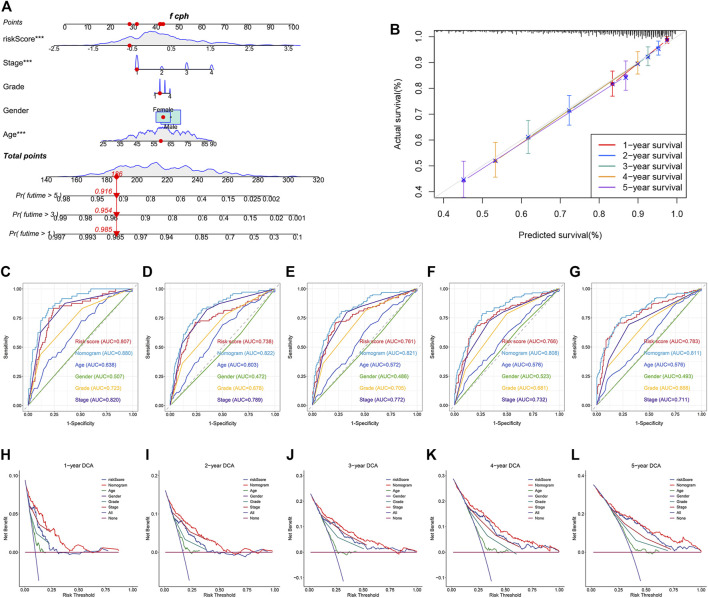
FIGURE 9.
Construction and validation of a nomogram for predicting OS in TCGA dataset. (A) Construction of a nomogram based on age, gender, tumor grade, stage, and risk score. (B) Verification of the predictive accuracy of the nomogram by calibration curves. (C–G) ROC curves of the nomogram, risk score, and clinical parameters for predicting the 1-, 2-, 3-, 4- and 5-year OS. (H–L) DCA curves for comparing the net survival benefit of the nomogram, risk score, and clinical parameters.

