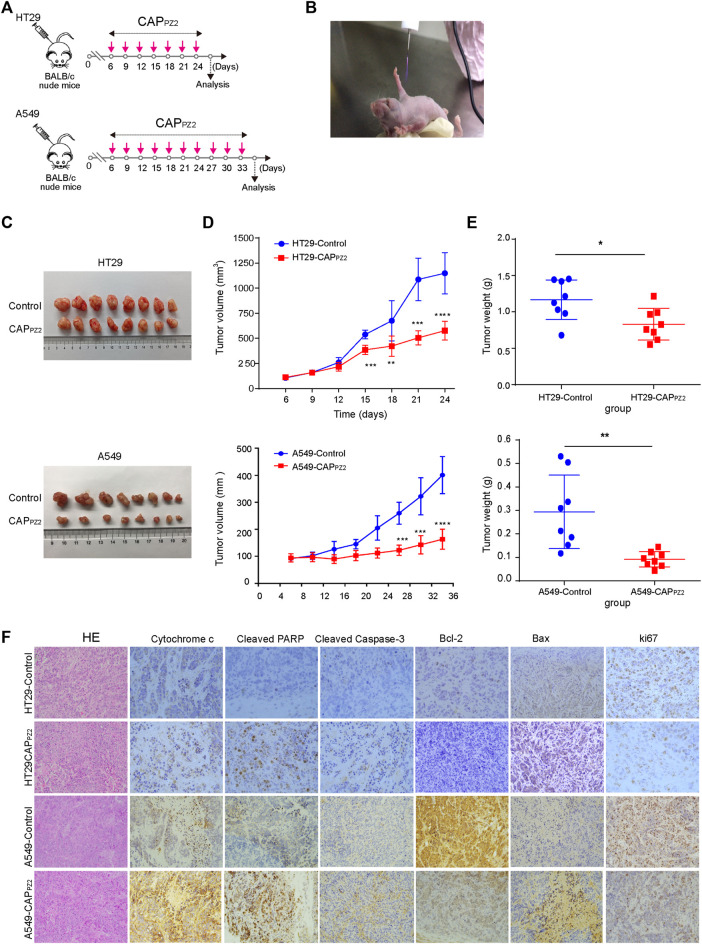
FIGURE 8.
In vivo CAPPZ2 treatment of mouse xenograft tumors. (A) Flowchart of in vivo CAPPZ2 therapy regimen. (B) Photograph of an operating Piezobrush® PZ2 CAP device irradiating tumors on a nude mouse bearing the HT29 or A549 cells. (C) Pathological specimens of resected in situ tumors with and without CAPPZ2 treatment. (D) Tumor growth curves of mice xenografts during the entire course of CAPPZ2 treatment. (E) Tumor weight after the last dose of plasma administration (*p < 0.05, **p < 0.01, ***p < 0.001, n = 8). (F) Representative histological images characterizing tumours and Immunohistochemical analysis using antibodies against various apoptosis-related proteins. Scale bar = 50 μm.

