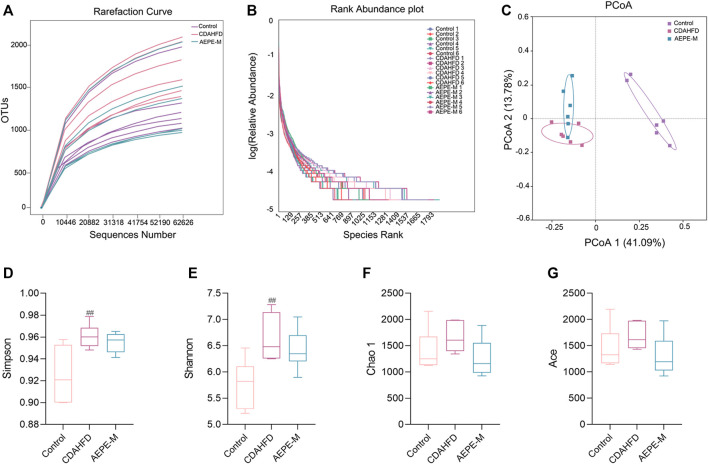
FIGURE 5.
AEPE treatment affected the diversity in CDAHFD mice. (A) Rarefaction curve flattened out indicated that the sequencing depth has basically covered all the species in the sample. (B) Rank abundance indicated that the libraries were large enough to cover most of the bacterial diversity in each sample. (C) PCoA indicated more similar beta diversity between the AEPE-M and control groups than that between the CDAHFD and control groups. (D,E) Simpson’s and Shannon’s indexes were higher in the CDAHFD group than in the control group. (F,G) There were no significant differences in the Chao 1 index and the Ace index in each group. Control, CDAHFD, and AEPE-M (n = 6 per group) groups. Data are presented as the mean ± SEM. ## p < 0.01 as compared to the control group.

