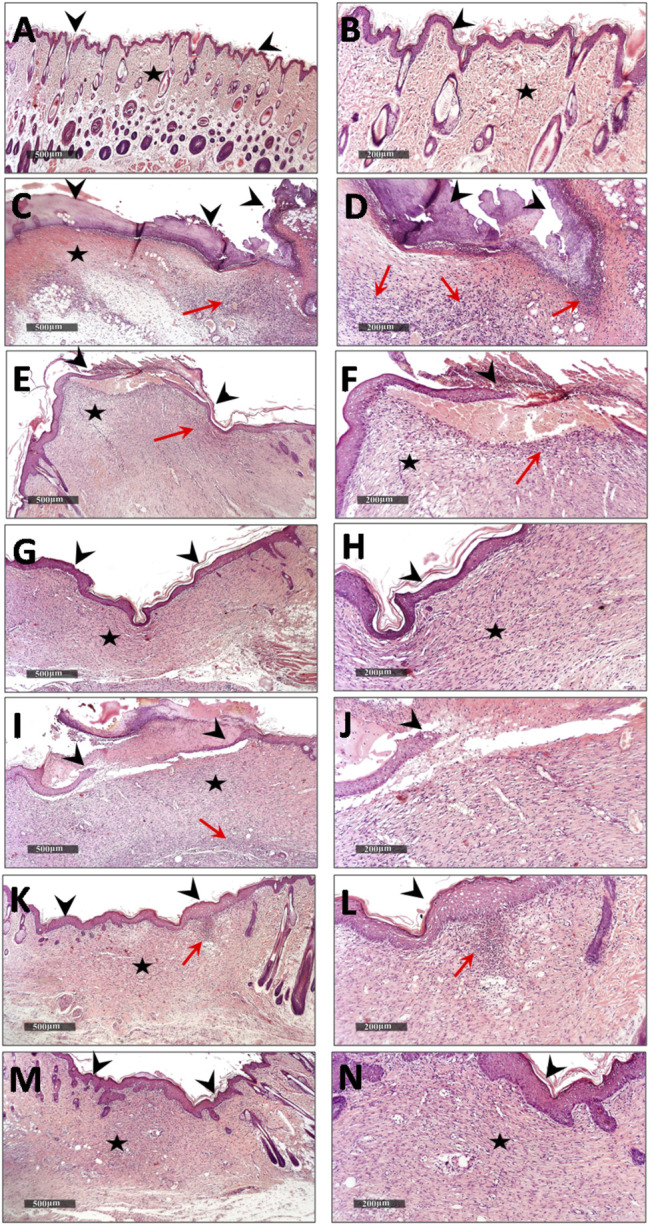
FIGURE 9.

Demonstrating light microscopic histological features of skin layers and wound healing process in different groups (A,B), normal control (C,D), wound control group (E,F). D. tortuosa 1% (G,H), D. tortuosa 2%, (I,J), D. triradiata 1%, (K,L), D. triradiata 2% (M,N) and standard treated group (H&E stain). Arrow head : epidermal layer and wound gab, Star: skin dermis and Red arrow: inflammatory cells aggregates.
